


3.2 线性回归的从零开始代码实现
一、代码实现
# %matplotlib inline 语句在PyCharm中会报错,将其删除在代码后使用plt.show()来显示图表
import random
import torch
from d2l import torch as d2l
from matplotlib import pyplot as plt # 用plt.show()方法来显示图表
# ***3.2.1 生成数据集
# 实现方程 y = Xw + b + 噪声
def synthetic_data(w, b, num_examples):
X = torch.normal(0, 1, (num_examples, len(w))) # 从标准正态分布提取张量
y = torch.matmul(X, w) + b
y += torch.normal(0, 0.01, y.shape)
return X, y.reshape((-1, 1)) # 指定为-1的行或列会随机分配一个数据
true_w = torch.tensor([2, -3.4])
true_b = 4.2
features, labels = synthetic_data(true_w, true_b, 1000)
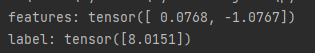
# features 中的每⼀⾏都包含⼀个⼆维数据样本,labels 中的每⼀⾏都包含⼀维标签值(⼀个标量)
print('features:', features[0], '\nlabel:', labels[0])
# ⽣成第⼆个特征 features[:, 1] 和 labels 的散点图,直观观察两者之间的线性关系
d2l.set_figsize() # 默认参数为 figsize=(3.5, 3.5) 表示图标大小
d2l.plt.scatter(features[:, (1)].detach().numpy(), labels.detach().numpy(), 1) # scatter(x, y, 点的大小, 颜色,标记)
plt.show() # 在PyCharm中使用此方法显示图表
# ***3.2.2 读取数据集
# 随机抽取小批量,每个小批量包含⼀组特征和标签
def data_iter(batch_size, features, labels):
num_examples = len(features)
indices = list(range(num_examples))
random.shuffle(indices) # 随机打乱数组顺序
for i in range(0, num_examples, batch_size):
batch_indices = torch.tensor(indices[i:min(i + batch_size, num_examples)])
yield features[batch_indices], labels[batch_indices]
# yield返回该数值,并且记录该位置,下次调用在该位置继续运行函数
batch_size = 10
# ***3.2.3初始化参数模型
# 从均值为0、标准差为0.01的正态分布中采样随机数来初始化权重,并将偏置初始化为0
w = torch.normal(0, 0.01, size=(2, 1), requires_grad=True)
b = torch.zeros(1, requires_grad=True)
# ***3.2.4定义模型
def linreg(X, w, b):
# 线性回归模型
return torch.matmul(X, w) + b
# ***3.2.5定义损失函数
def squared_loss(y_hat, y):
# 均方损失
return (y_hat - y.reshape(y_hat.shape))**2 / 2
# ***3.2.6定义优化算法
def sgd(params, lr, batch_size):
# ⼩批量随机梯度下降
with torch.no_grad():
for param in params:
param -= lr * param.grad / batch_size
param.grad.zero_()
# ***3.2.7训练
lr = 0.03
num_epochs = 3
net = linreg
loss = squared_loss
for epoch in range(num_epochs):
for X, y in data_iter(batch_size, features, labels):
l = loss(net(X, w, b), y) # 'x'和'y'的小批量损失
l.sum().backward()
sgd([w, b], lr, batch_size) # 使用参数的梯度更新参数
# 因为`l`形状是(`batch_size`, 1),⽽不是⼀个标量。`l`中的所有元素被加到⼀起,并以此计算关于[`w`, `b`]的梯度
with torch.no_grad():
train_l = loss(net(features, w, b), labels)
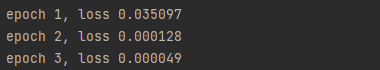
print(f'epoch {epoch + 1}, loss {float(train_l.mean()):f}')
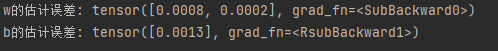
print(f'w的估计误差: {true_w - w.reshape(true_w.shape)}')
print(f'b的估计误差: {true_b - b}')
二、输出样式展示
源代码共有四处输出语句块分别展示如下。注意由于是随机生成的数据,每次的输出不尽相同。
1.第一处输出
2.第二处输出

3.第三处输出
4.第四处输出


 1703
1703


 被折叠的 条评论
为什么被折叠?
被折叠的 条评论
为什么被折叠?
 到【灌水乐园】发言


