


 该文介绍如何使用VBA在Excel中自动生成图表,特别是在指定位置。代码示例展示了如何创建XY散点图,并通过`Application.InputBox`获取用户选择的单元格区域。用户可以选择输入区域,然后调用函数生成图表。文章还提到了输入框参数中`Type=8`用于选择单元格的用途。
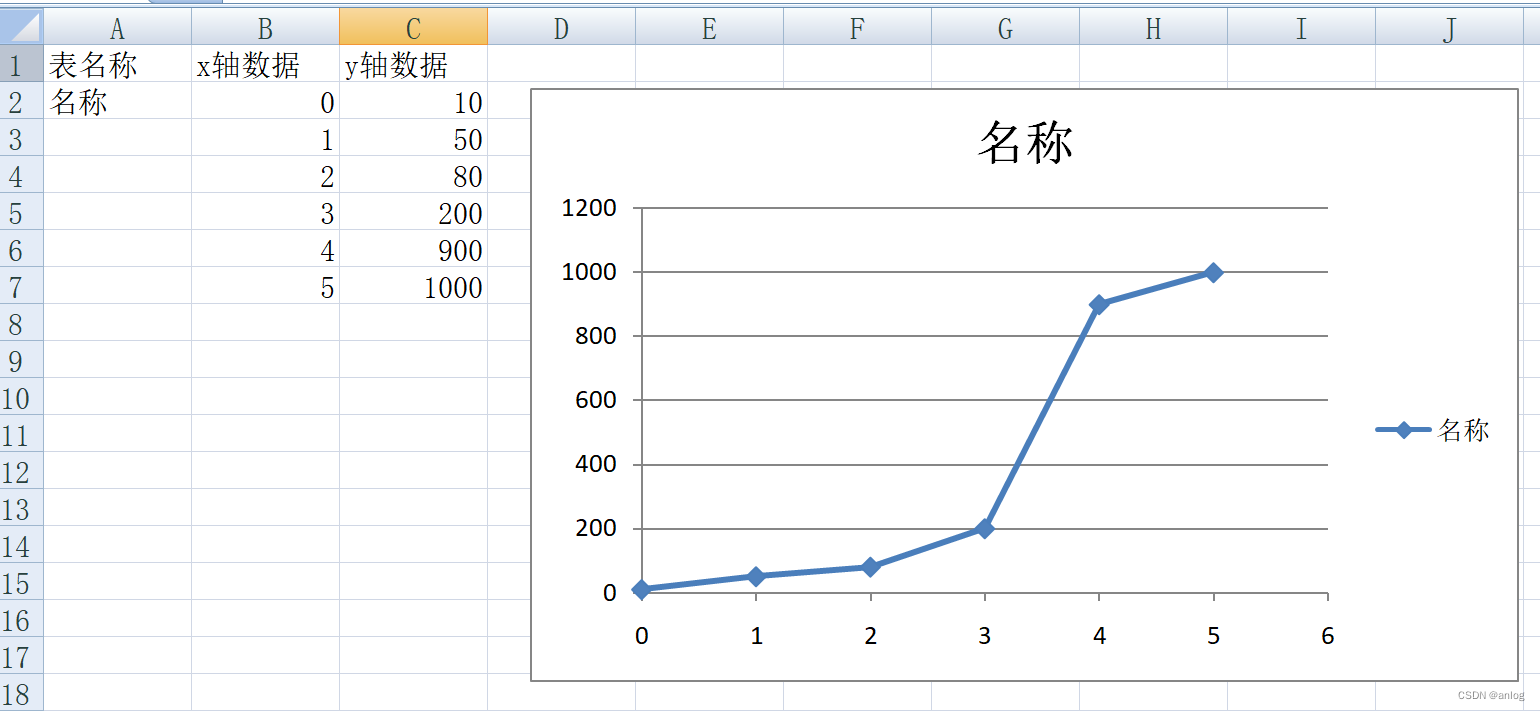
手动生成效果如下图
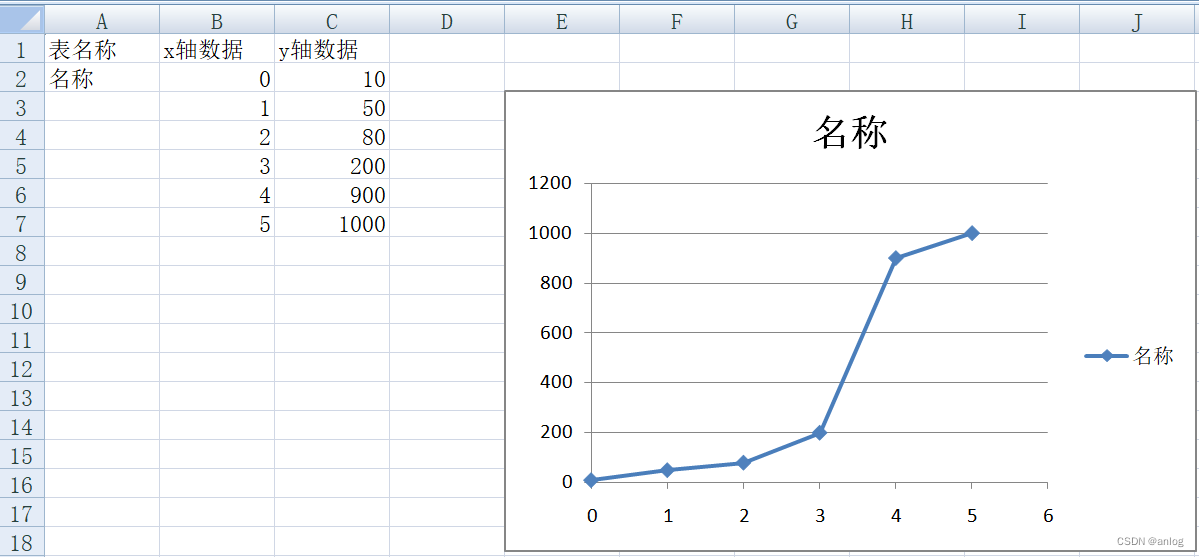
代码控制生成
代码如下
Sub 指定位置生成图表例程()
    Set weizhi = Range("E3:J18") '生成图表的位置
    Set obChart = ActiveSheet.ChartObjects.Add(0, 0, 0, 0)

    obChart.Top = weizhi.Top
    obChart.Left = weizhi.Left
    obChart.Width = weizhi.Width
    obChart.Height = weizhi.Height

    obChart.Chart.ChartType = xlXYScatter 'xy图
    obChart.Chart.SeriesCollection.NewSeries
    obChart.Chart.SeriesCollection(1).Name = "=Sheet1!$A$2"
    obChart.Chart.SeriesCollection(1).XValues = "=Sheet1!$B$2:$B$7"
    obChart.Chart.SeriesCollection(1).Values = "=Sheet1!$C$2:$C$7"

End Sub
其他参考代码(使用函数调用)
Sub 指定位置生成图表例程2(ByVal str As String)
    'Set weizhi = Range("E3:J18") '生成图表的位置
    Set weizhi = Range(str) '生成图表的位置

    Set obChart = ActiveSheet.ChartObjects.Add(0, 0, 0, 0)

    obChart.Top = weizhi.Top
    obChart.Left = weizhi.Left
    obChart.Width = weizhi.Width
    obChart.Height = weizhi.Height

    obChart.Chart.ChartType = xlXYScatter 'xy图
    obChart.Chart.SeriesCollection.NewSeries
    obChart.Chart.SeriesCollection(1).Name = "=Sheet1!$A$2"
    obChart.Chart.SeriesCollection(1).XValues = "=Sheet1!$B$2:$B$7"
    obChart.Chart.SeriesCollection(1).Values = "=Sheet1!$C$2:$C$7"

End Sub

Sub RangeInput()
    Dim rg As Range
    Set rg = Application.InputBox("请选择单元格区域", "选取提示", , , , , , 8)
    'MsgBox rg.Parent.Name & "!" & rg.Address
    Call 指定位置生成图表例程2(rg.Parent.Name & "!" & rg.Address)
End Sub
此例中由用户选择输入区域光影 inputbox函数的使用参考
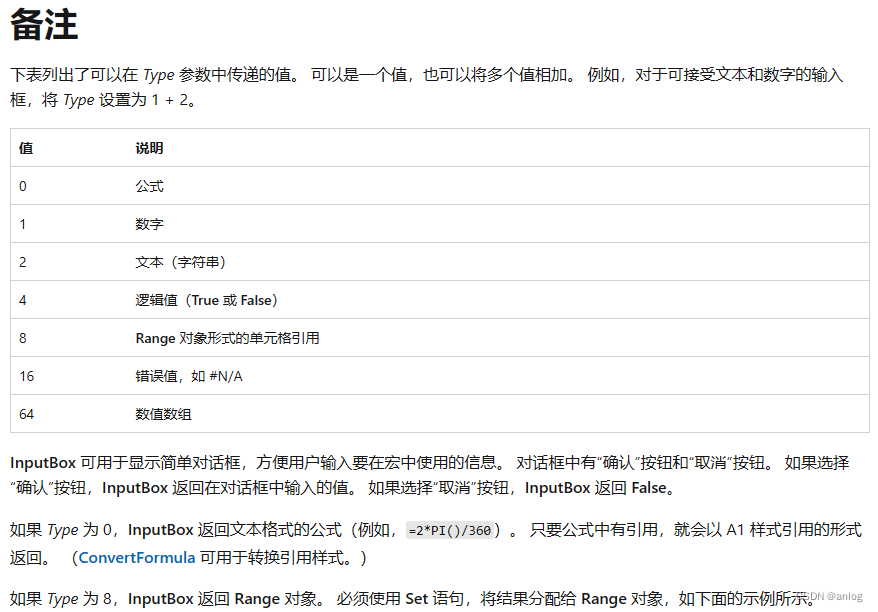
Application.InputBox 方法 (Excel) | Microsoft Learn https://learn.microsoft.com/zh-cn/office/vba/api/excel.application.inputbox上例中最后一个参数(参数8)是关键参数决定了输入的类型,当然可是明确指出确定的类型。
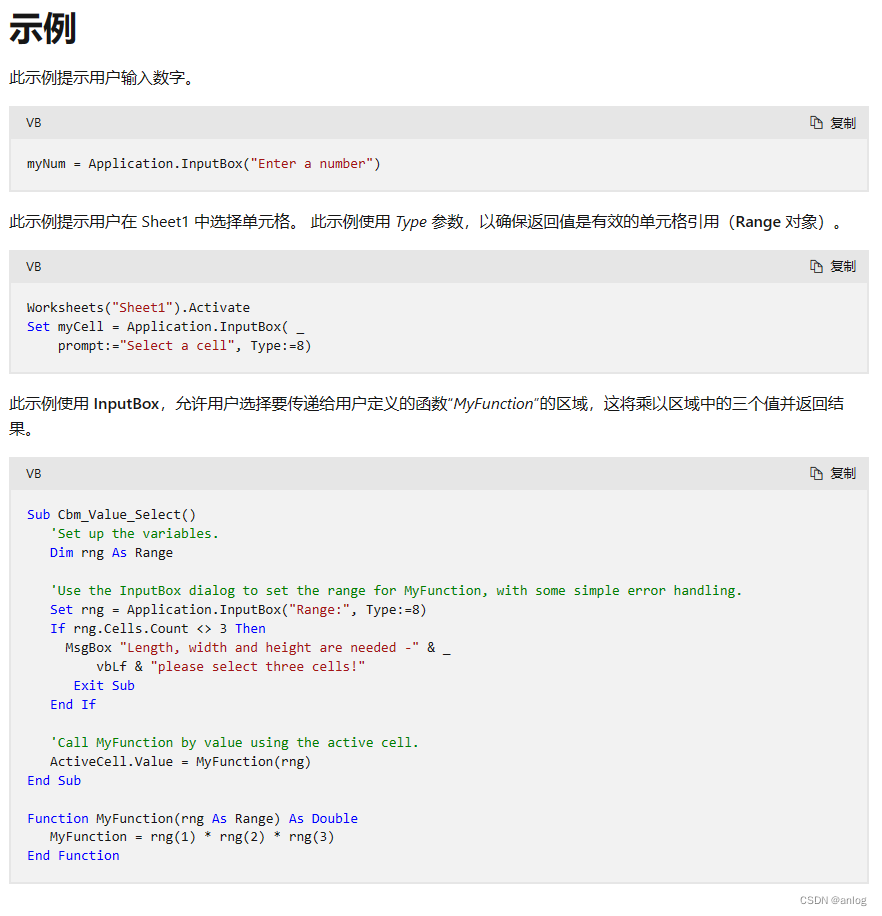
Worksheets("Sheet1").Activate
Set myCell = Application.InputBox( _
    prompt:="Select a cell", Type:=8)
直接使用 type:=8就可以不用输入太多i的逗号
type的详细解释
特此记录
anlog
2023年6月3日


 9529
9529

 被折叠的 条评论
为什么被折叠?
被折叠的 条评论
为什么被折叠?
 到【灌水乐园】发言


