1)用路径绘图:
beginPath()——开始一条新路径;
closePath()——尝试闭合现有路径,方法是绘制一条线,连接最后那条线的终点与初始坐标;
fill()——填充用子路径描述的图形;
isPointInPath(x,y)——如果指定的点在当前路径所描述的图形之内则返回true;
lineTo(x,y)——绘制一条到指定坐标的子路径;
moveTo(x,y)——移动到指定坐标而不绘制子路径;
rect(x,y,w,h)——绘制一个矩形,其左上角位于(x,y),宽度是w,高度是h;
stroke()——给子路径描述的图形绘制轮廓线;
<style type="text/css">
        canvas{
            border:thin solid black;
            margin: 4px;
        }
        body > *{
            float: left;
        }
    </style>
<canvas id="canvas1" width="500" height="140">
您的浏览器不支持<code>canvas</code>!
</canvas> <script>
//由直线创建路径
var ctx=document.getElementById("canvas1").getContext("2d");
ctx.fillStyle="#136455";
ctx.strokeStyle="blue";
ctx.lineWidth=4;
ctx.beginPath();
ctx.moveTo(10,10);
ctx.lineTo(110,10);
ctx.lineTo(110,120);
ctx.closePath();
ctx.fill();
ctx.beginPath();
ctx.moveTo(150,10);
ctx.lineTo(200,10);
ctx.lineTo(200,120);
ctx.lineTo(190,120);
ctx.fill();
ctx.stroke();
ctx.beginPath();
ctx.moveTo(250,10);
ctx.lineTo(250,120);
ctx.stroke();
</script>
    <canvas id="canvas2" width="500" height="140">
        您的浏览器不支持<code>canvas</code>!
    </canvas>
<script>
//设置lineCap属性
var ctx2=document.getElementById("canvas2").getContext("2d");
ctx2.strokeStyle="red";
ctx2.lineWidth=2;
ctx2.beginPath();
ctx2.moveTo(0,50);
ctx2.lineTo(200,50);
ctx2.stroke();
ctx2.strokeStyle="black";
ctx2.lineWidth=40;
var xpos=50;
var styles=["butt","round","square"];
for(var i=0;i<styles.length;i++){
ctx2.beginPath();
ctx2.lineCap=styles[i];
ctx2.moveTo(xpos,50);
ctx2.lineTo(xpos,150);
ctx2.stroke();
xpos+=50;
}
</script>
    <canvas id="canvas3" width="500" height="140">
        您的浏览器不支持<code>canvas</code>!
    </canvas>
<script>
//用Rect方法绘制矩形
var ctx3=document.getElementById("canvas3").getContext("2d");
ctx3.fillStyle="yellow";
ctx3.strokeStyle="black";
ctx3.lineWidth=4;
ctx3.beginPath();
ctx3.moveTo(110,10);
ctx3.lineTo(110,100);
ctx3.lineTo(10,10);
ctx3.closePath();
ctx3.rect(110,10,100,90);
ctx3.rect(110,100,130,30);
ctx3.fill();
ctx3.stroke();
</script>
2)绘制圆弧:
arc(x,y,rad,startAngle,endAngle,direction)——绘制一段圆弧到(x,y),半径为rad,起始角度为 startAngle,结束角度为endAngle。可选参数direction指定了圆弧的方向;
arcTo(x1,y1,x2,y2,rad)——绘制一段半径为rad,经过(x1,y1),直到(x2,y2)的圆弧;
    <canvas id="canvas4" width="500" height="140">
        您的浏览器不支持<code>canvas</code>!
    </canvas>
<script>
//使用arcTo方法
var ctx4=document.getElementById("canvas4").getContext("2d");
var point1=[100,10];
var point2=[200,10];
var point3=[200,110];
ctx4.fillStyle="yellow";
ctx4.strokeStyle="black";
ctx4.lineWidth=4;
ctx4.beginPath();
ctx4.moveTo(point1[0],point1[1]);
ctx4.arcTo(point2[0],point2[1],point3[0],point3[1],100);
ctx4.stroke();
drawPoint(point1[0],point1[1]);
drawPoint(point2[0],point2[1]);
drawPoint(point3[0],point3[1]);
ctx4.beginPath();
ctx4.moveTo(point1[0],point1[1]);
ctx4.lineTo(point2[0],point2[1]);
ctx4.lineTo(point3[0],point3[1]);
ctx4.stroke();
function drawPoint(x,y){
ctx4.lineWidth=1;
ctx4.strokeStyle="red";
ctx4.strokeRect(x-2,y-2,4,4);
}
</script>
    <canvas id="canvas5" width="500" height="140">
        您的浏览器不支持<code>canvas</code>!
    </canvas>
<script>
//响应鼠标移动绘制圆弧
var canvasElem = document.getElementById("canvas5");
var ctx5 = canvasElem.getContext("2d");
var point1 = [100, 10];
var point2 = [200, 10];
var point3 = [200, 110];
draw();
canvasElem.onmousemove = function (e) {
if (e.ctrlKey) {
point1 = [e.clientX, e.clientY];
} else if(e.shiftKey) {
point2 = [e.clientX, e.clientY];
} else {
point3 = [e.clientX, e.clientY];
}
ctx5.clearRect(0, 0, 540, 140);
draw();
}
function draw() {
ctx5.fillStyle = "yellow";
ctx5.strokeStyle = "black";
ctx5.lineWidth = 4;
ctx5.beginPath();
ctx5.moveTo(point1[0], point1[1]);
ctx5.arcTo(point2[0], point2[1], point3[0], point3[1], 50);
ctx5.stroke();
drawPoint(point1[0], point1[1]);
drawPoint(point2[0], point2[1]);
drawPoint(point3[0], point3[1]);
ctx5.beginPath();
ctx5.moveTo(point1[0], point1[1]);
ctx5.lineTo(point2[0], point2[1]);
ctx5.lineTo(point3[0], point3[1]);
ctx5.stroke();
}
function drawPoint(x, y) {
ctx5.lineWidth = 1;
ctx5.strokeStyle = "red";
ctx5.strokeRect(x -2, y-2, 4, 4);
}
</script>
    <canvas id="canvas6" width="500" height="140">
        您的浏览器不支持<code>canvas</code>!
    </canvas>
<script>
//使用arc方法
var ctx6=document.getElementById("canvas6").getContext("2d");
ctx6.fillStyle="yellow";
ctx6.lineWidth=3;
ctx6.beginPath();
ctx6.arc(70,70,60,0,Math.PI,true);
ctx6.stroke();
ctx6.beginPath();
ctx6.arc(200,70,60,Math.PI/2,Math.PI/4,false);
ctx6.fill();
ctx6.stroke();
ctx6.beginPath();
var val=0;
for(var i=0;i<4;i++){
ctx6.arc(350,70,60,val,val+Math.PI/4,false);
val+=Math.PI/2;
}
ctx6.closePath();
ctx6.fill();
ctx6.stroke();
</script>
3)绘制贝塞尔曲线
bezierCurveTo(cx1,cy1,cx2,cy2,x,y)——绘制一段贝塞尔曲线到点(x,y),控制点为(cx1,cy1)和(cx2,cy2);
quadraticCurveTo(cx,xy,x,y)——绘制一段二次贝塞尔曲线到点(x,y),控制点为(cx,cy);
<canvas id="canvas" width="500" height="140">
            Your browser doesn't support the <code>canvas</code> element
        </canvas>
<script>
var canvasElem = document.getElementById("canvas");
var ctx = canvasElem.getContext("2d");
var startPoint = [50, 100];
var endPoint = [400, 100];
var cp1 = [250, 50];
var cp2 = [350, 50];
canvasElem.onmousemove = function(e) {
if (e.shiftKey) {
cp1 = [e.clientX, e.clientY];
} else if (e.ctrlKey) {
cp2 = [e.clientX, e.clientY];
}
ctx.clearRect(0, 0, 500, 140);
draw();
}
draw();
function draw() {
ctx.lineWidth = 3;
ctx.strokeStyle = "black";
ctx.beginPath();
ctx.moveTo(startPoint[0], startPoint[1]);
ctx.bezierCurveTo(cp1[0], cp1[1], cp2[0], cp2[1],
endPoint[0], endPoint[1]);
ctx.stroke();
ctx.lineWidth = 1;
ctx.strokeStyle = "red";
var points = [startPoint, endPoint, cp1, cp2];
for (var i = 0; i < points.length; i++) {
drawPoint(points[i]);
}
drawLine(startPoint, cp1);
drawLine(endPoint, cp2);
}
function drawPoint(point) {
ctx.beginPath();
ctx.strokeRect(point[0] -2, point[1] -2, 4, 4);
}
function drawLine(from, to) {
ctx.beginPath();
ctx.moveTo(from[0], from[1]);
ctx.lineTo(to[0], to[1]);
ctx.stroke();
}
</script> <canvas id="canvas" width="500" height="140">
Your browser doesn't support the <code>canvas</code> element
</canvas> <script>
//绘制二次贝塞尔曲线
var canvasElem = document.getElementById("canvas");
var ctx = canvasElem.getContext("2d");
var startPoint = [50, 100];
var endPoint = [400, 100];
var cp1 = [250, 50];
canvasElem.onmousemove = function(e) {
if (e.shiftKey) {
cp1 = [e.clientX, e.clientY];
}
ctx.clearRect(0, 0, 500, 140);
draw();
}
draw();
function draw() {
ctx.lineWidth = 3;
ctx.strokeStyle = "black";
ctx.beginPath();
ctx.moveTo(startPoint[0], startPoint[1]);
ctx.quadraticCurveTo(cp1[0], cp1[1], endPoint[0], endPoint[1]);
ctx.stroke();
ctx.lineWidth = 1;
ctx.strokeStyle = "red";
var points = [startPoint, endPoint, cp1];
for (var i = 0; i < points.length; i++) {
drawPoint(points[i]);
}
drawLine(startPoint, cp1);
drawLine(endPoint, cp1);
}
function drawPoint(point) {
ctx.beginPath();
ctx.strokeRect(point[0] -2, point[1] -2, 4, 4);
}
function drawLine(from, to) {
ctx.beginPath();
ctx.moveTo(from[0], from[1]);
ctx.lineTo(to[0], to[1]);
ctx.stroke();
}
</script>
4)创建剪辑区域
clip()——创建新的裁剪区域;
    <canvas id="canvas7" width="500" height="140">
        您的浏览器不支持<code>canvas</code>!
    </canvas>
<script>
var ctx7=document.getElementById("canvas7").getContext("2d");
ctx7.fillStyle="yellow";
ctx7.beginPath();
ctx7.rect(0,0,500,140);
ctx7.fill();
ctx7.beginPath();
ctx7.rect(100,20,300,100);
ctx7.clip();
ctx7.fillStyle="red";
ctx7.beginPath();
ctx7.rect(0,0,500,140);
ctx7.fill();
</script>
5)绘制文本:
fillText(<text>,x,y,width)——在位置(x,y)上绘制并填充文本。宽度参数可选,用来设置文本宽度的上限;
strokeText(<text>,x,y,width)——在位置(x,y)上绘制并描边文本。宽度参数可选,用来设置文本宽度的上限;
font——设置绘制文本时使用的字体;
textAlign——设置文本的对齐方式:start、end、left、right、center;
textBaseline——设置文本的基线:top、hanging、middle、alphabetic、ideographic、bottom;
6)使用特效和转换:
6.1)使用阴影:
shadowBlur——设置阴影的模糊程度;
shadowColor——设置阴影的颜色;
shadowOffsetX——设置阴影的水平偏移量;
shadowOffsetY——设置阴影的垂直偏移量;
   <canvas id="canvas8" width="500" height="140">
        您的浏览器不支持<code>canvas</code>!
    </canvas>
<script>
//给图形和文本应用阴影
var ctx8=document.getElementById("canvas8").getContext("2d");
ctx8.fillStyle="lightgrey";
ctx8.strokeStyle="black";
ctx8.lineWidth=3;
ctx8.shadowOffsetX=5;
ctx8.shadowOffsetY=5;
ctx8.shadowBlur=5;
ctx8.shadowColor="grey";
ctx8.beginPath();
ctx8.arc(420,70,50,0,Math.PI,true);
ctx8.stroke();
ctx8.beginPath();
ctx8.arc(420,80,40,0,Math.PI,false);
ctx8.fill();
ctx8.font="100px sans-serif";
ctx8.fillText("hello",50,100);
ctx8.strokeText("hello",50,100);
</script>
6.2)使用透明度:
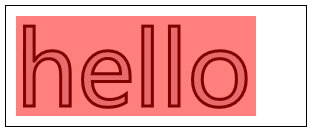
globalAlpha——给文本和图形设置透明度(从0到1);
    <canvas id="canvas9" width="300" height="120">
        您的浏览器不支持<code>canvas</code>!
    </canvas>
<script>
//使用globalAlpha属性,设置透明度
var ctx9=document.getElementById("canvas9").getContext("2d");
ctx9.fillStyle="lightgrey";
ctx9.strokeStyle="black";
ctx9.lineWidth=3;
ctx9.font="100px sans-serif";
ctx9.fillText("hello",10,100);
ctx9.strokeText("hello",10,100);
ctx9.fillStyle="red";
ctx9.globalAlpha=0.5;
ctx9.fillRect(10,10,240,100);
</script>
6.3)使用合成:
globalCompositeOperation——与透明度属性结合使用,来控制图形和文本在画布上绘制的方式;
globalCompositeOperation允许的值:
=copy——将来源绘制于目标之上,忽略一切透明度设置;
=source-atop——在两个图像都不透明处显示来源图像,
目标图像不透明但来源图像透明处显示目标图像,其它位置显示为透明;
=source-in——来源图像和目标图像都不透明处显示来源图像。其它位置显示为透明;
=source-out——来源图像不透明但目标图像透明处显示来源图像。其它位置显示为透明;
=source-over——来源图像不透明处显示来源图像。其它位置显示目标图像;
=destination-atop——与source-atop相同,但用目标图像替代来源图像,反之亦然;
=destination-in——与source-in相同,但用目标图像替代来源图像,反之亦然;
=destination-over——与source-over相同,但用目标图像替代来源图像,反之亦然;
=destination-out——与source-out相同,但用目标图像替代来源图像,反之亦然;
=lighter——显示来源图像与目标图像的总和,颜色值限制最高255(100%);
=xor——对来源图像和目标图像执行异或运算;
    <canvas id="canvas10" width="300" height="120">
        您的浏览器不支持<code>canvas</code>!
    </canvas>
    <label>Comosition Value:</label>
    <select id="list">
        <option>copy</option>
        <option>destination-atop</option>
        <option>destination-in</option>
        <option>destination-over</option>
        <option>destination-out</option>
        <option>lighter</option>
        <option>source-atop</option>
        <option>source-in</option>
        <option>source-out</option>
        <option>source-over</option>
        <option>xor</option>
    </select>
<script>
//使用globalCompositeOperation属性
var ctx10=document.getElementById("canvas10").getContext("2d");
ctx10.fillStyle="lightgrey";
ctx10.strokeStyle="black";
ctx10.lineWidth=3;
var compVal="copy";
document.getElementById("list").οnchange=function(e){
compVal= e.target.value;
draw();
}
draw();
function draw(){
ctx10.clearRect(0,0,300,120);
ctx10.globalAlpha=1.0;
ctx10.font="100px sans-serif";
ctx10.fillText("hello",10,100);
ctx10.strokeText("hello",10,100);
ctx10.globalCompositeOperation=compVal;
ctx10.fillStyle="red";
ctx10.globalAlpha=0.5;
ctx10.fillRect(100,10,150,100);
}
</script>
6.4)使用变换:
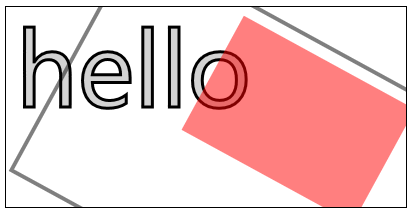
scale(<xScale>,<yScale>)——沿X轴缩放画布xScale倍,沿Y轴yScale倍;
rotate(<angle>)——使画布围绕点(0,0)顺时针旋转指定的弧度数;
translate(<x>,<y>)——重映射画布坐标为沿X轴x,沿Y轴y;
transform(a,b,c,d,e,f)——合并现有的变换和a-f值所指定的矩阵;
setTansform(a,b,c,d,e,f)——用a-f值所指定的矩阵替换现有的变换;
    <canvas id="canvas11" width="400" height="200">
        您的浏览器不支持<code>canvas</code>!
    </canvas>
<script>
//使用变换
var ctx11=document.getElementById("canvas11").getContext("2d");
ctx11.fillStyle="lightgrey";
ctx11.strokeStyle="black";
ctx11.lineWidth=3;
ctx11.clearRect(0,0,300,120);
ctx11.globalAlpha=1.0;
ctx11.font="100px sans-serif";
ctx11.fillText("hello",10,100);
ctx11.strokeText("hello",10,100);
ctx11.scale(1.3,1.3);
ctx11.translate(100,-50);
ctx11.rotate(0.5);
ctx11.fillStyle="red";
ctx11.globalAlpha=0.5;
ctx11.fillRect(100,10,150,100);
ctx11.strokeRect(0,0,300,200);
</script>


 2555
2555

 被折叠的 条评论
为什么被折叠?


