


 本文介绍了如何使用Python处理缠论中的K线包含关系,包括取最高价和最低价,判断K线位置关系,并提供了相应的代码实现。
以下是处理包含关系的步骤:
1、K线只取最高价,最低价

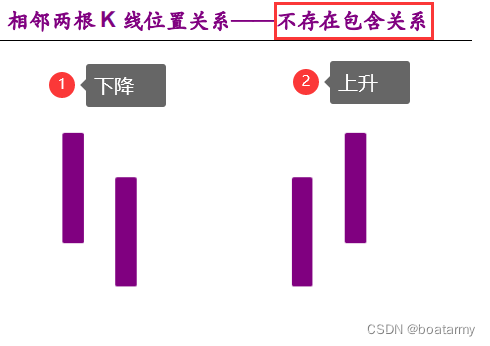
2、判断前后两根K线的位置关系

3、处理包含关系
代码实现:
(以前一直用C,python也是现学的,很多c的路数,请见谅)
contain.py
#包含处理
#第2根K线的最高价最低价被第1根k线的最高价最低价范围覆盖,或者二者关系反之,定义为包含关系
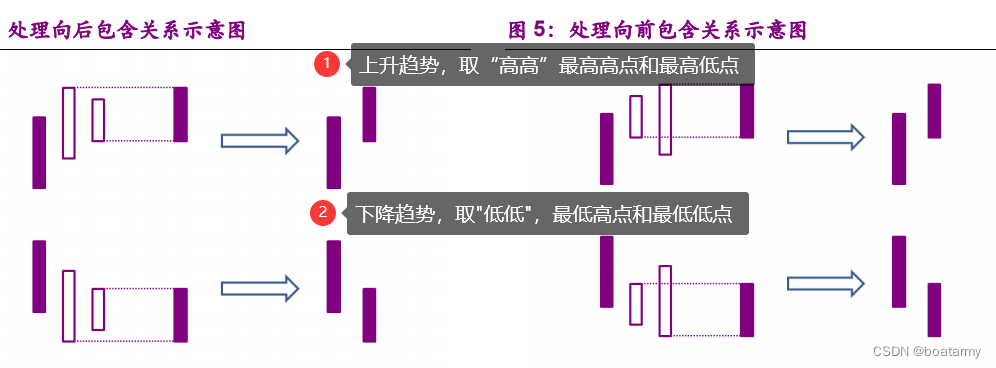
#具体处理向前/向后包含关系时,又要考察存在包含关系的两根K线与他们前一根K线的位置关系。
#在处理向前/向后包含关系时,如果存在包含关系K线相比较他们的前一根K线位置上升,则采用向上处理方式
#即取两根K线的最高价中高的价格作为处理后得到的新K线的最高价,取两根K线最低价中高的价格做为新K线的最低价
#如果存在包含关系的K线相较前一根K线位置下降,则采用向下处理的方式,即取两根K线最高价中低的价格作为新K线的最高价
#取两根K线最低价中低的价格作为新K线的最高价。
#简化表述:上升取高高,下降取低低
class contain_point:
def __init__(self, low_price, high_price):
self.high = high_price
self.low = low_price
def cl_contain_judge(updown,p_0,p_1):
ret_p=contain_point(0,0)
if p_1.high==p_1.low:#第二根k线开盘涨停或跌停
ret_p.high = 0
ret_p.low = 0
elif p_0.high>=p_1.high and p_0.low<=p_1.low:#前包含
if updown == "up": #上升型,高高
ret_p.high=p_0.high
ret_p.low=p_1.low
elif updown == "down": #下降型,低低
ret_p.high=p_1.high
ret_p.low=p_0.low
else: #最开始的几根k线如果无法判断分型,就使用取高低的方法
ret_p.high=p_0.high
ret_p.low=p_0.low
elif p_0.high<=p_1.high and p_0.low>=p_1.low:#后包含
if updown == "up": #上升型,高高
ret_p.high=p_1.high
ret_p.low=p_0.low
elif updown == "down": # 下降型,低低
ret_p.high=p_0.high
ret_p.low=p_1.low
else: #最开始的几根k线如果无法判断趋势,就使用取高低的方法
ret_p.high=p_1.high
ret_p.low=p_1.low
else:
ret_p.high = 0
ret_p.low = 0
return ret_p
def cl_contain_handle(oclh):
for i in range(len(oclh)):#每个数据后面加一个字段“d”(data),“c”(contain)
oclh[i].append("d")
updown="null"
for i in range(len(oclh)-1):
p0 = contain_point(oclh[i][2],oclh[i][3])
p1 = contain_point(oclh[i+1][2],oclh[i+1][3])
if p0.low!=0 and p0.high!=0:
if p0.low<p1.low and p0.high<p1.high:
updown="up"
elif p0.low>p1.low and p0.high>p1.high:
updown="down"
ret=cl_contain_judge(updown,p0,p1)
if ret.low!=0 and ret.high!=0:
# oclh[i][2]=0#第1根K线置0
# oclh[i][3]=0
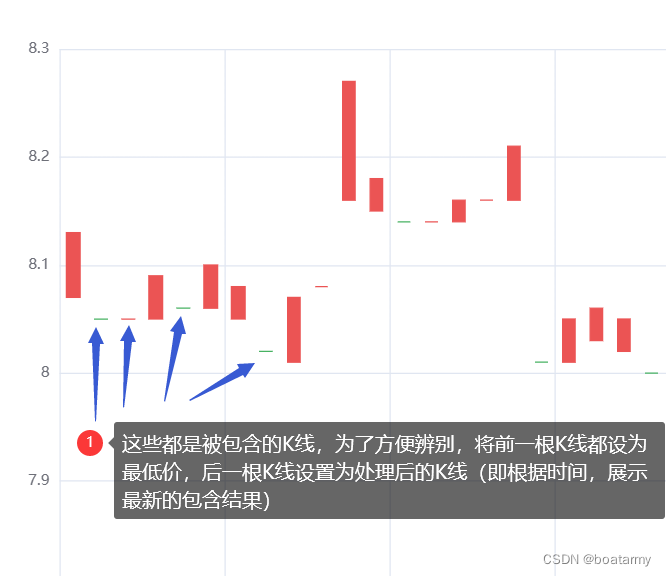
oclh[i][3]=oclh[i][2]#第1根K线的oclh都置为low值
oclh[i][4]="c" #标记前一根K线已被包含
oclh[i+1][2]=ret.low#第2根K线设置为处理后的K线
oclh[i+1][3]=ret.high
#将开盘价=最低价,收盘价=最高价
oclh[i][0] = oclh[i][2]
oclh[i][1] = oclh[i][3]
oclh[i+1][0] = oclh[i+1][2]
oclh[i+1][1] = oclh[i+1][3]
main.py
if __name__ == '__main__':
# 创建一个空的DataFrame
d1_df=pd.DataFrame()
api = TdxHq_API()
with api.connect('119.147.212.81', 7709):
stck_name="000626.sz"
d1_df=get_tdx_data(api, stck_name, '30m')
stock_charts(d1_df,stck_name+"_30m",4)
tdx.py
# category(类别) K线种类
# 0 5分钟K线 1 15分钟K线 2 30分钟K线 3 1小时K线 4 日K线 5 周K线 6 月K线 7 1分钟 8 1分钟K线 9 日K线 10 季K线 11 年K线
# market(市场)
# 0 - 深圳, 1 - 上海
# code,股票代码
# start 指定的范围开始位置
# cont 用户要请求的 K 线数目,最大值为 800
# def write_tdx_to_db():
# api = TdxHq_API()
# with api.connect('119.147.212.81', 7709):
# df=api.to_df(api.get_security_bars(2, 0, code, 0, 10)) # 返回DataFrame
# df.insert(0,'code',code);
# data=json.loads(df.T.to_json()).values()
# collection=database[code]#建立以股票名命名的合集
# collection.insert_many(data)#存储到mongodb数据库中
# code:股票代码,格式xxxx.SZ,xxxx.SH
# bar_type:日线的类型,1d,30m,5m,
# start:指定的范围
# count:指定的k线条数
K_NUM=(800)
def get_tdx_data(tdx_api,code,bar_type):
bar_t=0
data=[]
if bar_type=='1d':
bar_t=4
elif bar_type=='30m':
bar_t=2
elif bar_type=='5m':
bar_t=0
market=0
if code.find('sz')!=-1 or code.find('SZ')!=-1:
market=0
elif code.find('sh')!=-1 or code.find('SH')!=-1:
market=1
c_name=code[0:6]#取股票的名字
# print(market)
c_name=c_name+'_'+bar_type
# data=tdx_api.get_security_bars(bar_t, market, c_name, 208, 20)
data=tdx_api.get_security_bars(bar_t, market, c_name, K_NUM, K_NUM)
data+=tdx_api.get_security_bars(bar_t, market, c_name, 0, K_NUM)
df=tdx_api.to_df(data) # 返回DataFrame
# print(df)
return df
chart.py
def stock_charts(df, stocks_name,bi_judge_num):
# tdx数据是从最早到最近,不用倒序排列
# 将dataframe倒序排列,ascending=True为顺序排列,False为倒序,inplace一定要设置为True
# df.sort_index(ascending=False, inplace=True)
# 返回多列数据,使用[[...]]
#pyecharts的kline要求oclh
oclh = df[['open', 'close', 'low', 'high']]
date = df[['datetime']]
close = df[['close']]
# print(oclh)
# pandas的tolist方法将获取到的数据转化为列表
#iloc[]函数,属于pandas库,全称为index location,即对数据进行位置索引,从而在数据表中提取出相应的数据
#比如:df.iloc[a,b],其中df是DataFrame数据结构的数据,a是行索引,b是列索引
# 数据格式[['open','close','high','low'],['open','close','high','low'],....]
oclh_tolist_org = [oclh.iloc[i].tolist() for i in range(len(oclh))]
date_tolist = [date.iloc[i].tolist() for i in range(len(date))]
close_tolist = [close.iloc[i].tolist() for i in range(len(close))]#嵌套列表[[1],[2],[3]]
#去掉嵌套变为[1,2,3]
date_list = []
for i in range(len(date_tolist)):
date_list.insert(i, date_tolist[i][0])
#去掉嵌套变为[1,2,3]
close_list = []
for i in range(len(close_tolist)):
close_list.insert(i, close_tolist[i][0])
#使用新的列表存储处理了包含后的数据
oclh_tolist_contain=copy.deepcopy(oclh_tolist_org)
#输入oclh_org数据,输出处理了包含后的oclh数据,其中只有最高点和最低点,收盘价和开盘价=0
cl_contain_handle(oclh_tolist_contain)
#画图
#cl包含图
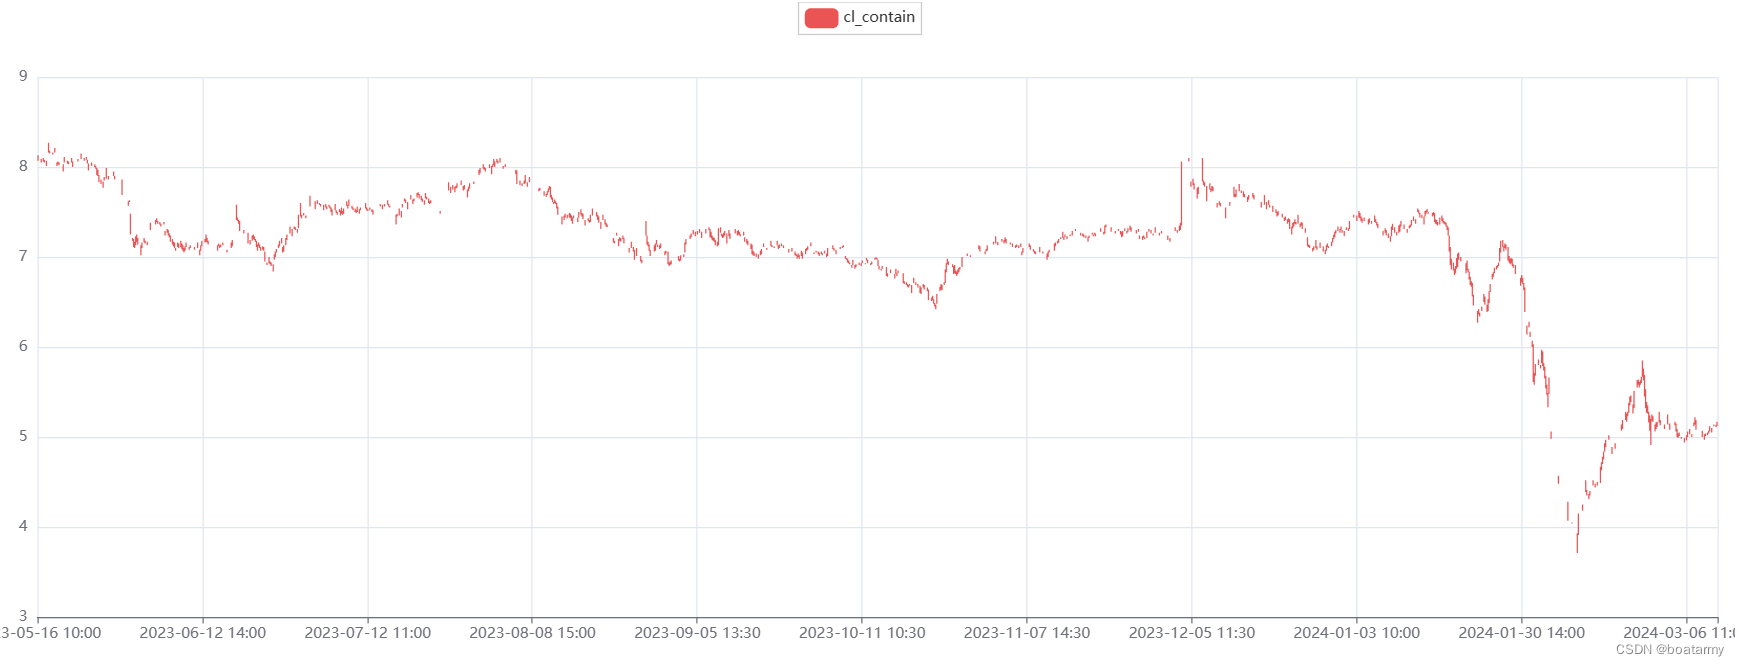
cl_contain_kline = draw_kline(date_list,"cl_contain",oclh_tolist_contain)
grid=Grid(init_opts=opts.InitOpts(width="1400px", height="720px")
grid.add(cl_contain_kline,grid_opts=opts.GridOpts(pos_left="3%",pos_right="1%",height="60%"))
grid.render("{}.html".format(stocks_name))
运行效果:


 2060
2060

 被折叠的 条评论
为什么被折叠?
被折叠的 条评论
为什么被折叠?
 到【灌水乐园】发言


