


 本文描述了在MATLAB中使用带有数学符号(如$alpha$)的图例时遇到的问题,如何通过设置Interpreter为latex来解决,以及参考了MATLABAnswers和MATLABCentral社区的内容。
问题:
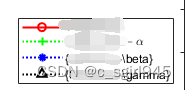
使用legend显示图例时,带有数学符号(例如 等)的标签无法正确显示。如图,我希望全部显示成绿色线对应的情况,但最开始都是蓝黑线的显示情况。
解决过程:
浏览器搜索: MATLAB legend math symbol。最后在MATLAB的官方社区找到解决方式。
解决方式:
plot(1:10)
legend({'$\alpha$'},'Interpreter','latex') % R2018a and earlier
legend('$\alpha}$','Interpreter','latex') % R2018b and later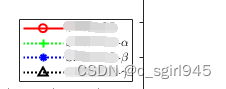


 1万+
1万+


 被折叠的 条评论
为什么被折叠?
被折叠的 条评论
为什么被折叠?
 到【灌水乐园】发言


