


 通过JavaScript和canvas,结合prototype,本文展示了如何将数据结构中的邻接矩阵转化为可拖动调整的有向图直观表示。在解决一道题目时,强调了不对称矩阵对应有向图的特点,并提供了在线演示链接。
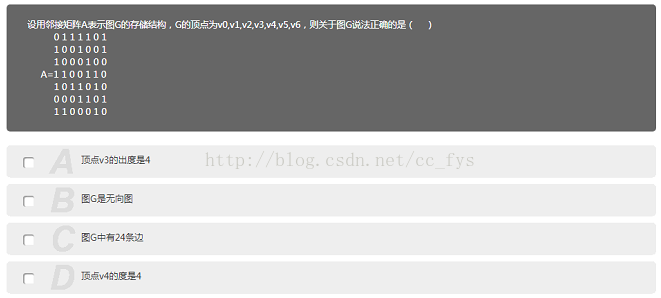
做题做到了这样一道题,设用邻接矩阵A表示图G的存储结构,G的顶点为V0,V1,V2,V3,V4,V5,V6,则关于图G的说法正确的是
这道题比较简单,基本思路是:
不对称矩阵是有向图
有向图才会有入度和出度
学习JS做练习,刚好使用对象这一块内容,用JavaScript,canvas,prototype将数据结构中邻接矩阵的图做一个直观表示。
/**
 * Created by CC on 2017/9/4.
 */
var Gra=function(){
this.elem=arguments[0];
this.options=arguments[1];
this.width=this.elem.width;
this.height=this.elem.height;
this.context=this.elem.getContext('2d');
this.deName=false;
this.isSymmetric=true;
this.pointSize=15;
this.pointData=[];
this.init();
}
Gra.prototype.init=function()
{
var name=this.options.name;
 this.num=this.options.data.length;
if(name&&name.length!=0)
    {
        this.deName=true;
    }
    this.drawPoint();
    this.drawEdge();
    this.initaction();
}
//绘顶点
Gra.prototype.drawPoint=function()
{
    var ctx=this.context;
    var num=this.num;
    var dia=(this.width<this.height) ? this.width : this.height;
    var centerx=this.width/2;
    var centery=this.height/2;
    var rad=2*Math.PI/num;
    for(var i=0;i<num;i++) {
        var y = (dia / 2 - 30) * Math.sin(rad * i) + centery;
        var x = (dia / 2 - 30) * Math.cos(rad * i) + centerx;
        ctx.beginPath();
        ctx.strokeStyle='#000';
        ctx.lineWidth=1;
        ctx.arc(x, y, this.pointSize, 0, 2 * Math.PI, false);
        ctx.stroke();
        this.pointData.push({x:x,y:y})
    }
}
//绘边
Gra.
最低0.47元/天 解锁文章


 88
88

 被折叠的 条评论
为什么被折叠?
被折叠的 条评论
为什么被折叠?
 到【灌水乐园】发言


