


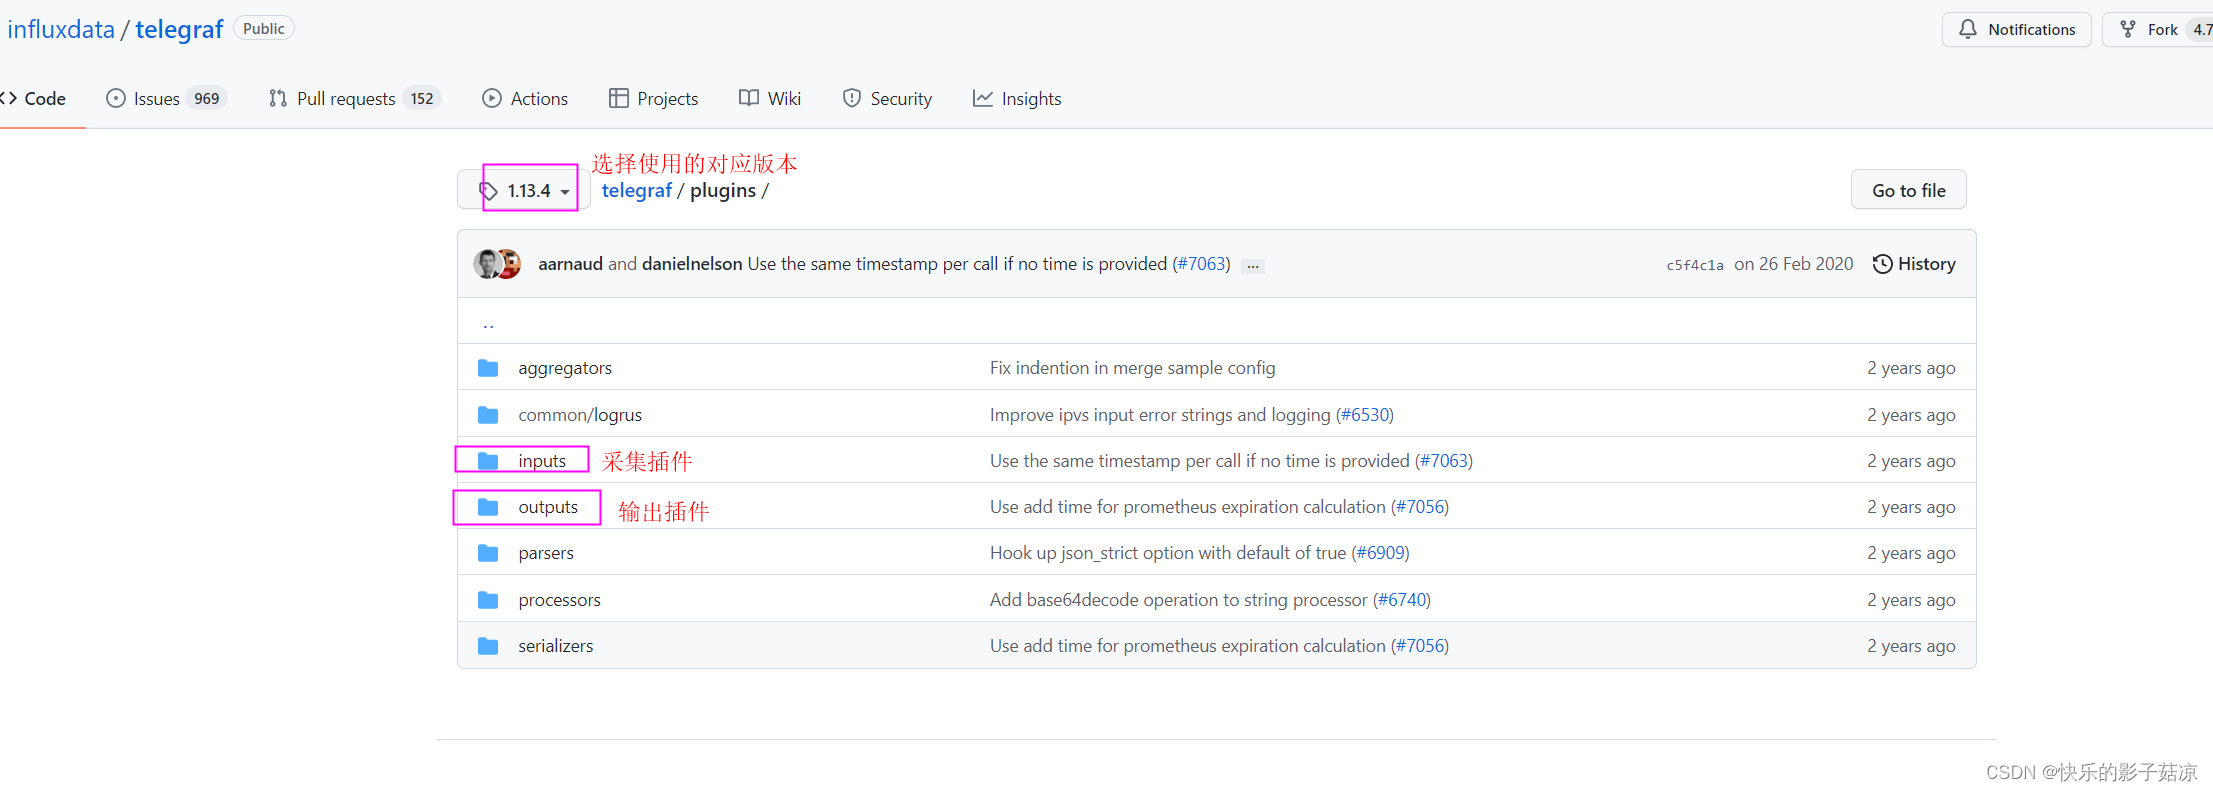
telegraf github地址:https://github.com/influxdata/telegraf
需求背景:
现需要搭建一个监控系统,需要采集服务器相关的信息和部分业务数据,采用telegraf统一去采集相关数据,业务数据场景是采集用户每次调用接口的响应时间
-
设计:在网关拦截器中将每次接口的调用信息,存储到json文件中
-
telegraf去采集数据
2.1 使用inputs节点,inputs支持很丰富的格式,点击inputs——>tail,tail适用于追加文件内容,只要文件有追加的内容,就采集数据
2.2 tail相关配置, data_format 指定文件的输入类型
# Stream a log file, like the tail -f command
[[inputs.tail]]
 ## files to tail.
 ## These accept standard unix glob matching rules, but with the addition of
 ## ** as a "super asterisk". ie:
 ##   "/var/log/**.log"  -> recursively find all .log files in /var/log
 ##   "/var/log/*/*.log" -> find all .log files with a parent dir in /var/log
 ##   "/var/log/apache.log" -> just tail the apache log file
 ##
 ## See https://github.com/gobwas/glob for more examples
 ##
 files = ["/var/mymetrics.out"]
 ## Read file from beginning.
 from_beginning = false
 ## Whether file is a named pipe
 pipe = false

 ## Method used to watch for file updates.  Can be either "inotify" or "poll".
 # watch_method = "inotify"

 ## Data format to consume.
 ## Each data format has its own unique set of configuration options, read
 ## more about them here:
 ## https://github.com/influxdata/telegraf/blob/master/docs/DATA_FORMATS_INPUT.md
 data_format = "influx"
2.3 根据https://github.com/influxdata/telegraf/blob/master/docs/DATA_FORMATS_INPUT.md,查看json格式的文件配置
[[inputs.file]]
  files = ["example"]

  ## Data format to consume.
  ## Each data format has its own unique set of configuration options, read
  ## more about them here:
  ## https://github.com/influxdata/telegraf/blob/master/docs/DATA_FORMATS_INPUT.md
  data_format = "json"

  ## When strict is true and a JSON array is being parsed, all objects within the
  ## array must be valid
  json_strict = true

  ## Query is a GJSON path that specifies a specific chunk of JSON to be
  ## parsed, if not specified the whole document will be parsed.
  ##
  ## GJSON query paths are described here:
  ##   https://github.com/tidwall/gjson/tree/v1.3.0#path-syntax
  json_query = ""

  ## Tag keys is an array of keys that should be added as tags.  Matching keys
  ## are no longer saved as fields. Supports wildcard glob matching.
  tag_keys = [
    "my_tag_1",
    "my_tag_2",
    "tags_*",
    "tag*"
  ]

  ## Array of glob pattern strings or booleans keys that should be added as string fields.
  json_string_fields = []

  ## Name key is the key to use as the measurement name.
  json_name_key = ""

  ## Time key is the key containing the time that should be used to create the
  ## metric.
  json_time_key = ""

  ## Time format is the time layout that should be used to interpret the json_time_key.
  ## The time must be `unix`, `unix_ms`, `unix_us`, `unix_ns`, or a time in the
  ## "reference time".  To define a different format, arrange the values from
  ## the "reference time" in the example to match the format you will be
  ## using.  For more information on the "reference time", visit
  ## https://golang.org/pkg/time/#Time.Format
  ##   ex: json_time_format = "Mon Jan 2 15:04:05 -0700 MST 2006"
  ##       json_time_format = "2006-01-02T15:04:05Z07:00"
  ##       json_time_format = "01/02/2006 15:04:05"
  ##       json_time_format = "unix"
  ##       json_time_format = "unix_ms"
  json_time_format = ""

  ## Timezone allows you to provide an override for timestamps that
  ## don't already include an offset
  ## e.g. 04/06/2016 12:41:45
  ##
  ## Default: "" which renders UTC
  ## Options are as follows:
  ##   1. Local               -- interpret based on machine localtime
  ##   2. "America/New_York"  -- Unix TZ values like those found in https://en.wikipedia.org/wiki/List_of_tz_database_time_zones
  ##   3. UTC                 -- or blank/unspecified, will return timestamp in UTC
  json_timezone = ""
示例
Config:
[[inputs.file]]
  files = ["example"]
  json_name_key = "name"
  tag_keys = ["my_tag_1"]
  json_string_fields = ["b_my_field"]
  data_format = "json"
Input:
{
    "a": 5,
    "b": {
        "c": 6,
        "my_field": "description"
    },
    "my_tag_1": "foo",
    "name": "my_json"
}
Output:
my_json,my_tag_1=foo a=5,b_c=6,b_my_field="description"
-
根据配置文档配置我的telegraf.conf文件
[[inputs.tail]] files = ["/opt/applog/app-gateway/app-response/*.json"] watch_method = "poll" data_format = "json" -
sh start.sh 启动telegraf
然鹅,telegraf并没有采集到我要的数据,入坑啦!!!
排查过程:
-
ps -ef | grep telegraf 查看telegraf是否启动了 【已启动】

-
查看日志 tail -1000f usr/nohup.out 【日志无报错信息】
2022-02-28T07:44:51Z I! Tags enabled: host=vm-osvm77983-app 2022-02-28T07:44:51Z I! [agent] Config: Interval:10s, Quiet:false, Hostname:"vm-osvm77983-app", Flush Interval:10s 2022-02-28T07:46:38Z I! Starting Telegraf 1.13.4 2022-02-28T07:46:38Z I! Loaded inputs: tail 2022-02-28T07:46:38Z I! Loaded aggregators: 2022-02-28T07:46:38Z I! Loaded processors: 2022-02-28T07:46:38Z I! Loaded outputs: kafka 2022-02-28T07:46:38Z I! Tags enabled: host=vm-osvm77983-app 2022-02-28T07:46:38Z I! [agent] Config: Interval:10s, Quiet:false, Hostname:"vm-osvm77983-app", Flush Interval:10s- 检查files的路径是否正常 cd /opt/applog/app-gateway/app-response/ | ls -l |grep “.json”|wc -l 【该路径下有5个文件】
-

尝试各个方式排查问题,卡住了好久,直到~~~
将官网上的示例配置进去,发现居然可以,那么问题应该定位到[[inputs.tail]]的配置文件,重点看配置文件中的属性节点,发现json_string_fields属性的注释表明,如果json文件中key对应的value值是string/boolean,则必须配置对应的key,日志文件也不报错。。。
  ## Array of glob pattern strings or booleans keys that should be added as string fields.
  json_string_fields = []
查看接口调用返回响应时间的json,含有字符串的value
{
    "serviceName":"order-server",
    "apiPath":"v1/order/order-query",
    "apiAccessTime":1646035200736,
    "apiUsedTime":20,
    "year":2022,
    "month":2,
    "week":9,
    "day":59
}
解决方法,修改[[inputs.tail]]的配置如下:
 [[inputs.tail]]
    files = ["/opt/applog/app-gateway/app-response/*.json"]
     watch_method = "poll"
     json_string_fields = ["serviceName","apiPath"]
     data_format = "json"


 2037
2037

 被折叠的 条评论
为什么被折叠?
被折叠的 条评论
为什么被折叠?
 到【灌水乐园】发言


