使用react-grid-layout和echarts-for-react实现一个支持拖拽的自定义响应式dashboard页面
需求概要
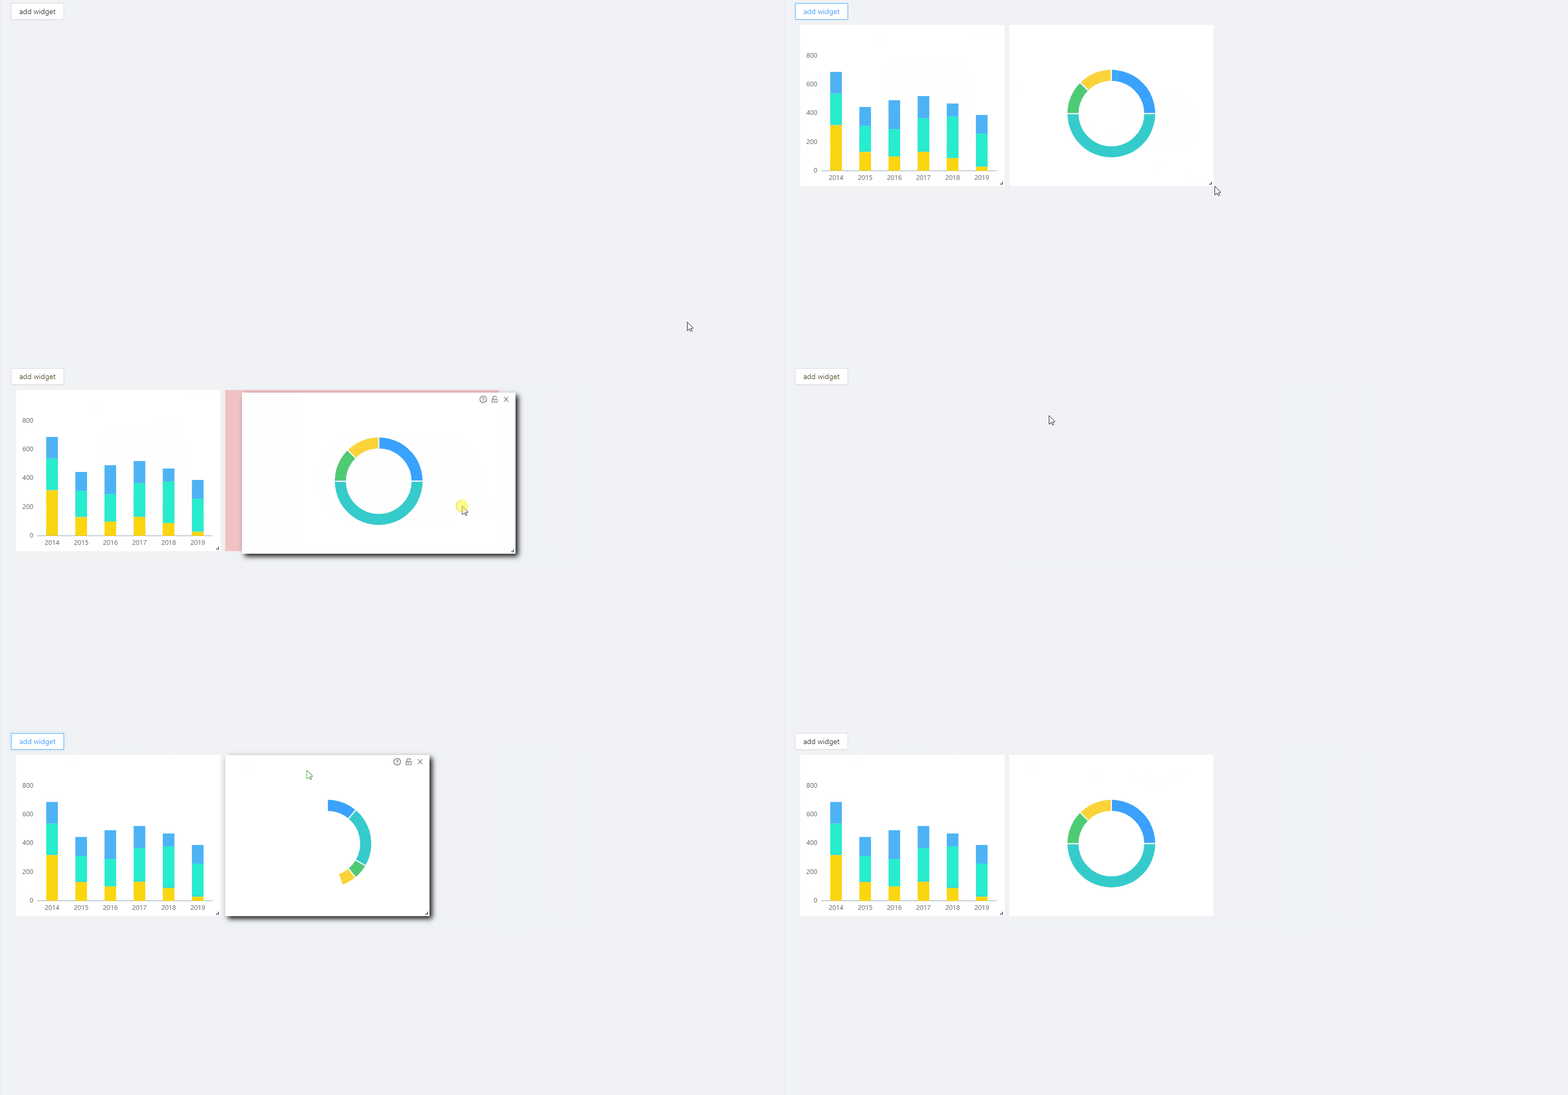
在前端工作中,我们会经常遇到自定义dashboard页这样的需求。然后我想做一个能够让用户可以在面板上自由的拖拽,固定(不允许拖拽),拖拉改变大小、新增,删除组件。组件可以是各种echarts图形,也可是各种数据表格。通过各个组件的拖拽组合,从而让用户自定义需要的dashboard页。
我们直接先来看最终的效果

技术栈
那我们这里就会是用到react-grid-layout和echarts-for-react
首先echarts-for-react,顾名思义就是用来绘制echarts图表的,这里不过多解释。然后react-grid-layout 是一个网格布局系统,可以实现响应式的网格布局,并且支持分割点(breakpoints)的设置,灵活运用可以方便的实现拖拽式组件的实现。
具体使用就不多介绍了,可以直接去官网看看,例子很多也很详细:https://github.com/react-grid-layout/react-grid-layout
简单实现
下面是dashboard的主渲染入口
import React, {useState} from "react";
import 'react-grid-layout/css/styles.css'
import 'react-resizable/css/styles.css'
import {Layout, Responsive, WidthProvider} from "react-grid-layout";
import {Button} from "antd";
import {findIndex} from "lodash";
import './dashboard.css'
import WidgetLoadingSpin from "@/pages/Dashboard/Detail/WidgetLoadingSpin";
import {CloseOutlined, LockOutlined, QuestionCircleOutlined, UnlockOutlined} from "@ant-design/icons";
const BarChartWidgetLazy = React.lazy(() => import('@/pages/Dashboard/Detail/Widget/BarChartWidget'));
const PieChartWidgetLazy = React.lazy(() => import('@/pages/Dashboard/Detail/Widget/PieChartWidget'));
const ResponsiveReactGridLayout = WidthProvider(Responsive);

interface DashboardWidgetInfo {
  widgetName: string,
  layout: Layout
}

function DashboardGird() {

  const [widgets, setWidgets] = useState<DashboardWidgetInfo[]>([]);
  const [currentCols, setCurrentCols] = useState<number>(12);

  const getLayouts: any = () => {
    return widgets.map(item => item.layout);
  }


  const setLayoutStatic = (widget: DashboardWidgetInfo, staticFlag: boolean) => {
    const index = findIndex(widgets, (w: any) => w.widgetName === widget.widgetName);
    if (index !== -1) {
      const updateWidget = widgets[index];
      updateWidget.layout.static = staticFlag;
      widgets.splice(index, 1, {...updateWidget});
      const newWidgets = [...widgets];
      setWidgets(newWidgets);
    }
  }

  const lockWidget = (widget: DashboardWidgetInfo) => {
    setLayoutStatic(widget, true);
  }

  const unlockWidget = (widget: DashboardWidgetInfo) => {
    setLayoutStatic(widget, false);
  }

  const onRemoveWidget = (widget: DashboardWidgetInfo) => {
    const widgetIndex = findIndex(widgets, (w: any) => w.layout.i === widget.layout.i);
    if (widgetIndex !== -1) {
      widgets.splice(widgetIndex, 1);
      const newWidgets = [...widgets];
      setWidgets(newWidgets);
    }
  }

  const getWidgetComponent = (widgetName: string) => {
    if (widgetName === 'PieChartWidget') { //可以改成策略
      return (<React.Suspense fallback={<WidgetLoadingSpin/>}>
        <PieChartWidgetLazy/>
      </React.Suspense>);
    } else {
      return (<React.Suspense fallback={<WidgetLoadingSpin/>}>
        <BarChartWidgetLazy/>
      </React.Suspense>);
    }
  }


  const createWidget = (widget: DashboardWidgetInfo) => {
    return (
        <div className={'dashboard-widget-wrapper'} key={widget.layout.i} data-grid={widget.layout}>
          <span className='dashboard-widget-header'>
            <QuestionCircleOutlined className={'dashboard-widget-header-icon'}/>
            {widget.layout.static ? <LockOutlined className={'dashboard-widget-header-icon'} onClick={() => unlockWidget(widget)}/> : (
                <UnlockOutlined className={'dashboard-widget-header-icon'} onClick={() => lockWidget(widget)}/>)}
            <CloseOutlined className={'dashboard-widget-header-icon'} onClick={() => onRemoveWidget(widget)}/>
          </span>
          {getWidgetComponent(widget.widgetName)}
        </div>
    );
  }


  const onAddWidget = () => {
    const x = (widgets.length * 3) % (currentCols);
    const widgetName = x % 2 == 0 ? 'BarChartWidget' : 'PieChartWidget'
    const newWidgets = [...widgets, {
      widgetName: widgetName,
      layout: {i: widgetName, x: x, y: Infinity, w: 3, h: 2, static: false}
    }] as DashboardWidgetInfo[];
    setWidgets(newWidgets);
  }

  const onBreakpointChange = (newBreakpoint: string, newCols: number) => {
    setCurrentCols(newCols);
  }

  const onLayoutChange = (layouts: any[]) => {
    for (const layout of layouts) {
      const updateIndex = findIndex(widgets, (w) => w.layout.i === layout.i);
      if (updateIndex !== -1) {
        const updateWidget = widgets[updateIndex];
        updateWidget.layout = layout;
        widgets.splice(updateIndex, 1, {...updateWidget});
      }
    }
    const newWidgets = [...widgets];
    setWidgets(newWidgets);
  }

  return (
      <>
        <Button onClick={onAddWidget}>add widget</Button>
        <ResponsiveReactGridLayout
            layouts={getLayouts()}
            className={'layouts'}
            onLayoutChange={onLayoutChange}
            onBreakpointChange={onBreakpointChange}>
          {widgets?.map(item => createWidget(item))}
        </ResponsiveReactGridLayout>
      </>
  );
}

export default DashboardGird
然后接下来是自己的一些自定制化的一些图表或者表格的组件
import React from "react";
import WidgetLoadingSpin from "@/pages/Dashboard/Detail/WidgetLoadingSpin";

const ReactEchartsLazy = React.lazy(() => import('echarts-for-react'));

function PieChartWidget() {
  const getPieChart = () => {
    return {
      color: ['#3AA1FF', '#36CBCB', '#4ECB73', '#FBD338'],
      tooltip: {
        trigger: 'item',
        formatter: '{a} <br/>{b}: {c} ({d}%)'
      },
      grid: {
        left: '3%',
        right: '4%',
        bottom: '3%',
        containLabel: true
      },
      series: [{
        name: '消费能力',
        type: 'pie',
        radius: ['40%', '55%'],
        center: ['50%', '55%'],
        avoidLabelOverlap: true,
        itemStyle: {
          normal: {
            borderColor: '#FFFFFF',
            borderWidth: 2
          }
        },
        label: {
          normal: {
            show: false,
          },
        },
        labelLine: {
          normal: {
            show: false
          }
        },
        data: [{
          name: 'a',
          value: '20'
        }, {
          name: 'b',
          value: '40'
        }, {
          name: 'c',
          value: '10'
        }, {
          name: 'd',
          value: '10'
        }]
      }]
    };
  }

  return (<React.Suspense fallback={<WidgetLoadingSpin/>}>
    <ReactEchartsLazy
        option={getPieChart()}
        notMerge={true}
        lazyUpdate={true}
        style={{width: '100%', height: '100%'}}/>
  </React.Suspense>)
}

export default PieChartWidget
import React from "react";
import WidgetLoadingSpin from "@/pages/Dashboard/Detail/WidgetLoadingSpin";

const ReactEchartsLazy = React.lazy(() => import('echarts-for-react'));

function BarChartWidget() {

  const getBarChart = () => {
    return {
      tooltip: {
        trigger: 'axis',
        axisPointer: {
          type: 'shadow'
        }
      },
      grid: {
        left: '3%',
        right: '4%',
        bottom: '3%',
        containLabel: true
      },
      xAxis: [{
        type: 'category',
        data: ['2014', '2015', '2016', '2017', '2018', '2019'],
        axisLine: {
          lineStyle: {
            color: '#8FA3B7',//y轴颜色
          }
        },
        axisLabel: {
          show: true,
          textStyle: {
            color: '#6D6D6D',
          }
        },
        axisTick: {show: false}
      }],
      yAxis: [{
        type: 'value',
        splitLine: {show: false},
        //max: 700,
        splitNumber: 3,
        axisTick: {show: false},
        axisLine: {
          lineStyle: {
            color: '#8FA3B7',//y轴颜色
          }
        },
        axisLabel: {
          show: true,
          textStyle: {
            color: '#6D6D6D',
          }
        },
      }],
      series: [

        {
          name: 'a',
          type: 'bar',
          barWidth: '40%',
          itemStyle: {
            normal: {
              color: '#FAD610'
            }
          },
          stack: '信息',
          data: [320, 132, 101, 134, 90, 30]
        },
        {
          name: 'b',
          type: 'bar',
          itemStyle: {
            normal: {
              color: '#27ECCE'
            }
          },
          stack: '信息',
          data: [220, 182, 191, 234, 290, 230]
        },
        {
          name: 'c',
          type: 'bar',
          itemStyle: {
            normal: {
              color: '#4DB3F5'
            }
          },
          stack: '信息',
          data: [150, 132, 201, 154, 90, 130]
        }
      ]
    };
  }

  return (
      <React.Suspense fallback={<WidgetLoadingSpin/>}>
        <ReactEchartsLazy
            option={getBarChart()}
            notMerge={true}
            lazyUpdate={true}
            style={{width: '100%', height: '100%'}}/>
      </React.Suspense>)
}


export default BarChartWidget
这里用到了React.lazy,所以还需要定制一下未加载时候渲染出来的组件
import {Spin} from "antd";
import React from "react";
import './dashboard.css'
function WidgetLoadingSpin(){

  return (
      <div className={'dashboard-widget-loading'}><Spin tip={'Loading...'}/></div>
  )
}


export default WidgetLoadingSpin;
最后是一些简单的CSS样式
.dashboard-widget-loading {
  display: flex;
  justify-content: center;
  align-items: center;
  width: 100%;
  height: 100%
}

.dashboard-widget-wrapper {
  background: white;
}

.dashboard-widget-wrapper:hover {
  box-shadow: 5px 5px 10px rgba(0, 0, 0, 0.9)
}

.dashboard-widget-header {
  display: none;
}

.dashboard-widget-header-icon {
  margin: 4px;
  opacity: 0.7;
}

.dashboard-widget-header-icon:hover {
  color: #00508E;
}


.dashboard-widget-wrapper:hover .dashboard-widget-header {
  position: absolute;
  right: 7px;
  top: 2px;
  cursor: pointer;
  z-index: 999;
  display: block;
}
参考
https://github.com/react-grid-layout/react-grid-layout
https://github.com/Bilif/react-drag-grid
React-grid-layout 一个支持拖拽的栅格布局库


 1739
1739


 被折叠的 条评论
为什么被折叠?


