


笔记
openLayers3引入地址
js:https://lib.baomitu.com/ol3/4.6.5/ol.js
css:https://lib.baomitu.com/ol3/4.6.5/ol.css
各个地图图层
- 高德地图
// 高德地图
let gaodeMapLayer = new ol.layer.Tile({
    title: "高德地图",
    source: new ol.source.XYZ({
        url: 'http://wprd0{1-4}.is.autonavi.com/appmaptile?lang=zh_cn&size=1&style=7&x={x}&y={y}&z={z}',
        wrapX: false
    })
});
- 百度地图
//坐标参考系
var projection = ol.proj.get("EPSG:3857");
//分辨率
var resolutions = [];
for (var i = 0; i < 19; i++) {
    resolutions[i] = Math.pow(2, 18 - i);
}
var tilegrid = new ol.tilegrid.TileGrid({
    origin: [0, 0],
    resolutions: resolutions
});
//拼接百度地图出图地址
var baidu_source = new ol.source.TileImage({
    //设置坐标参考系
    projection: projection,
    //设置分辨率
    tileGrid: tilegrid,
    //出图基地址
    tileUrlFunction: function (tileCoord, pixelRatio, proj) {
        if (!tileCoord) {
            return "";
        }
        var z = tileCoord[0];
        var x = tileCoord[1];
        var y = tileCoord[2];

        if (x < 0) {
            x = "M" + (-x);
        }
        if (y < 0) {
            y = "M" + (-y);
        }
        return "http://online3.map.bdimg.com/onlinelabel/?qt=tile&x=" + x + "&y=" + y + "&z=" + z + "&styles=pl&udt=20151021&scaler=1&p=1";
    }
});
//百度地图
var baidu_layer = new ol.layer.Tile({
    source: baidu_source
});
- 加载静态地图
// 加载指定的静态图片
new ol.layer.Image({
	source: new ol.source.ImageStatic({
 		url: '/static/image/2.jpeg',
 		imageExtent: extent //映射到地图的范围
 	})
 })
- 加载天地图
//天地图
//矢量底图
new ol.layer.Tile({
  source: new ol.source.XYZ({
  url:'http://t0.tianditu.gov.cn/vec_w/wmts?SERVICE=WMTS&REQUEST=GetTile&VERSION=1.0.0&LAYER=vec&STYLE=default&TILEMATRIXSET=w&FORMAT=tiles&TILEMATRIX={z}&TILEROW={y}&TILECOL={x}&tk=053318a29e7ee8be40a0958754cc1827'
  })
}),
//矢量标记
new ol.layer.Tile({
  source: new ol.source.XYZ({
  url:'http://t0.tianditu.gov.cn/cva_w/wmts?SERVICE=WMTS&REQUEST=GetTile&VERSION=1.0.0&LAYER=cva&STYLE=default&TILEMATRIXSET=w&FORMAT=tiles&TILEMATRIX={z}&TILEROW={y}&TILECOL={x}&tk=053318a29e7ee8be40a0958754cc1827'
  })
}),
使用案例
使用Draw绘制几何图形
效果展示
源代码
<template>
	<view>
		<button @click="ol.bindNone">无</button>
		<button @click="ol.bindPoint">点</button>
		<button @click="ol.bindLineString">线</button>
		<button @click="ol.bindCircle">圆</button>
		<button @click="ol.bindPolygon">多边形</button>
		<button @click="ol.bindBox">长方形</button>
		<button @click="ol.bindSquare">正方形</button>

		<view id="mapCon" style="width: 100%; height: 90%; position: absolute;"></view>

	</view>
</template>

<script>
	export default {
		data() {
			return {
				value: 'none'
			}
		},
		mounted() {
		},
		methods: {

		}
	}
</script>


<script module="ol" lang="renderjs">
	export default {
		data() {
			return {
				map: null,				// map容器
				layer: null,			// 地图图层
				lineLayer: null,	// 绘制层
				draw: null,				// 绘制交互
				source: null,			// 绘制交互的数据层
				coordinate: []
			}
		},
		mounted() {
			if (typeof window.ol === 'function') {
				this.initMap()
			} else {
				const script = document.createElement('script')
				// script.src = 'static/openLayers6.15/ol.js' //可以通过此方式导入jquery,echart库
				script.src = 'https://lib.baomitu.com/ol3/4.6.5/ol.js' //可以通过此方式导入jquery,echart库
				script.onload = this.initMap.bind(this)
				document.head.appendChild(script)
			}
		},
		methods: {
			initMap() {
				let TiandiMap_vec = new ol.layer.Tile({
						title: "天地图矢量图层",
						source: new ol.source.XYZ({
								url:'http://t0.tianditu.gov.cn/vec_w/wmts?SERVICE=WMTS&REQUEST=GetTile&VERSION=1.0.0&LAYER=vec&STYLE=default&TILEMATRIXSET=w&FORMAT=tiles&TILEMATRIX={z}&TILEROW={y}&TILECOL={x}&tk=053318a29e7ee8be40a0958754cc1827',
								// 限制图层在X轴方向上重复
								wrapX: false
						})
				});
				let Tianditu_cva = new ol.layer.Tile({
						title: "天地图矢量注记图层",
						source: new ol.source.XYZ({
								url:'http://t0.tianditu.gov.cn/cva_w/wmts?SERVICE=WMTS&REQUEST=GetTile&VERSION=1.0.0&LAYER=cva&STYLE=default&TILEMATRIXSET=w&FORMAT=tiles&TILEMATRIX={z}&TILEROW={y}&TILECOL={x}&tk=053318a29e7ee8be40a0958754cc1827',
								// 限制图层在X轴方向上重复
								wrapX: false
						})
				});

				// 实例化map对象加载地图
				this.map = new ol.Map({
					// 地图加载容器目标
					target:'mapCon',
					// 加载图层
					layers: [
						TiandiMap_vec,
						Tianditu_cva
					],
					// 地图视图设置
					view: new ol.View({
						// 地图初始化中心点
						center: [104, 30],
						// 地图初始化显示级别
						zoom: 2,
						projection: "EPSG:3857"
					})

				})

				// 创建源及图层
				this.source = new ol.source.Vector({wrapX: false});
				this.lineLayer = new ol.layer.Vector({
					source: this.source,
					// 样式
					style: new ol.style.Style({
						// 填充
						fill: new ol.style.Fill({
							color: 'rgba(255,255,255,0.2)'
						}),
						// 线
						stroke: new ol.style.Stroke({
							color: '#ffcc33',
							widht: 2
						}),
						image: new ol.style.Circle({
							radius: 7,
							fill: new ol.style.Fill({
								color: '#ffcc33'
							})
						})
					})
				})
				this.map.addLayer(this.lineLayer)

			},
			// 清空画笔
			bindNone() {
				console.log('无--------None')
				this.map.removeInteraction(this.draw)
			},
			// 画点
			bindPoint() {
				console.log('点--------Point')
				// 清空旧画笔
				this.map.removeInteraction(this.draw)
				this.draw = new ol.interaction.Draw({
					source: this.source,
					type: 'Point'
				})
				// 绘制结束后处理事件
				this.draw.on('drawend', function (e) {
					console.log('绘制结束--------', e)
					var coordinate_point = e.feature.getGeometry().getCoordinates();
					console.log('点坐标为:',coordinate_point)
				})

				this.map.addInteraction(this.draw)
			},
			//画线
			bindLineString() {
				console.log('线--------LineString')
				// 清空旧画笔
				this.map.removeInteraction(this.draw)
				this.draw = new ol.interaction.Draw({
					source: this.source,
					type: 'LineString'
				})

				// 绘制结束后处理事件
				this.draw.on('drawend', function (e) {
					console.log('绘制结束--------', e)
					var coordinate_LineString = e.feature.getGeometry().getCoordinates();
					console.log('线坐标为:',coordinate_LineString)
				})

				this.map.addInteraction(this.draw)
			},
			// 画圆
			bindCircle() {
				console.log('圆--------Circle')
				// 清空旧画笔
				this.map.removeInteraction(this.draw)
				this.draw = new ol.interaction.Draw({
					source: this.source,
					type: 'Circle'
				})

				// 绘制结束后处理事件
				this.draw.on('drawend', function (e) {
					console.log('绘制结束--------', e)
					var center = e.feature.getGeometry().getCenter();
					var radius = e.feature.getGeometry().getRadius();
					console.log('圆心坐标:',center)
					console.log('圆半径为:',radius)
				})

				this.map.addInteraction(this.draw)
			},
			// 画多边形
			bindPolygon() {
				console.log('多边形--------Polygon')
				// 清空旧画笔
				this.map.removeInteraction(this.draw)
				this.draw = new ol.interaction.Draw({
					source: this.source,
					type: 'Polygon'
				})

				// 绘制结束后处理事件
				this.draw.on('drawend', function (e) {
					console.log('绘制结束--------', e)
					var coordinates_Polygon = e.feature.getGeometry().getCoordinates();
					console.log('矩形坐标:',coordinates_Polygon)

				})

				this.map.addInteraction(this.draw)
			},
			// 画长方形
			bindBox() {
				console.log('长方形--------Box')
				// 清空旧画笔
				this.map.removeInteraction(this.draw)
				this.draw = new ol.interaction.Draw({
					source: this.source,
					type: 'LineString',
					// 最大点数
					maxPoints: 2,
					geometryFunction: function (coordinates, geometry) {
								if (!geometry) {
										//多边形
										geometry = new ol.geom.Polygon(null);
								}
								var start = coordinates[0];
								var end = coordinates[1];
								geometry.setCoordinates([
										[start, [start[0], end[1]], end, [end[0], start[1]], start]
								]);
								return geometry;
						}
				})

				// 绘制结束后处理事件
				this.draw.on('drawend', function (e) {
					console.log('绘制结束--------', e)
					var coordinates_Polygon = e.feature.getGeometry().getCoordinates();
					console.log('矩形坐标:',coordinates_Polygon)

				})

				this.map.addInteraction(this.draw)
			},
			// 画正方形
			bindSquare() {
				console.log('正方形--------Square')
				// 清空旧画笔
				this.map.removeInteraction(this.draw)
				this.draw = new ol.interaction.Draw({
					source: this.source,
					type: 'Circle',
					geometryFunction: ol.interaction.Draw.createRegularPolygon(4)
				})

				// 绘制结束后处理事件
				this.draw.on('drawend', function (e) {
					console.log('绘制结束--------', e)
					var coordinates_Polygon = e.feature.getGeometry().getCoordinates();
					console.log('矩形坐标:',coordinates_Polygon)

				})

				this.map.addInteraction(this.draw)
			}

		},

	}


</script>


<style>
/* @import url("@/static/openLayers6.15/ol.css"); */
@import url("https://lib.baomitu.com/ol3/4.6.5/ol.css");
</style>
地图标记
效果展示

源代码
用到的图片
<template>
	<view class="container">
		<img src="/static/image/1.png"/>
		<h2>真机调试</h2>
		<view id="olMap" class="olMap">
		</view>
	</view>
</template>


<script>
	export default {
		data() {
			return {

			}
		},
		methods: {

		}
	}
</script>

<script module="ol" lang="renderjs">
	//视图层renderjs操作,注意此层中不能uniapp提供相关接口。
	// import '../../static/openlayer/v6.6.1-dist/ol.js'不支持此导入方式否则,打包失败
	export default {
		data() {
			return {
				title: 'Hello'
			}
		},
		mounted() {
			if (typeof window.ol === 'function') {
				this.initAmap()
			} else {
				const script = document.createElement('script')
				script.src = 'static/openLayers6.15/ol.js' //可以通过此方式导入jquery,echart库
				script.onload = this.initAmap.bind(this)
				document.head.appendChild(script)
			}

		},
		methods: {

			 init() {
				console.log('init')
			},

			initAmap() {
				// this.imgy = this.$refs.myMap.offsetHeight
				// this.imgx = this.$refs.myMap.offsetWidth
				// this.imgy = 200
				// this.imgx = 300
				// let extent = [0, 0, this.imgx, this.imgy];  // 获取图片的宽高
				// // [minx, miny, maxx, maxy].
				// let projection = new Projection({
				// code: "xkcd-image",
				// units: "pixels",
				// extent: extent
				// });
				// 地图设置中心
				let center = ol.proj.transform([0, 0], 'EPSG:4326', 'EPSG:3857')
				// 计算图片映射到地图上的范围,保持比例的情况下。 放大100倍 除以2 让图片中心点和地图中心点重合
				let extent = [center[0] - (1080 ) / 2, center[1] - (756 ) / 2, center[0] + (1080 ) / 2, center[1] + (756) / 2]


				// 高德地图
				let gaodeMapLayer = new ol.layer.Tile({
						title: "高德地图",
						source: new ol.source.XYZ({
								url: 'http://wprd0{1-4}.is.autonavi.com/appmaptile?lang=zh_cn&size=1&style=7&x={x}&y={y}&z={z}',
								wrapX: false
						})
				});


				this.map = new ol.Map({
					layers: [


						// // 加载指定的静态图片
						// new ol.layer.Image({
						// 	source: new ol.source.ImageStatic({
						// 		url: '/static/image/2.jpeg',
						// 		imageExtent: extent //映射到地图的范围
						// 	})
						// })


						gaodeMapLayer

						// //天地图
						// //矢量底图
						// new ol.layer.Tile({
						// 	source: new ol.source.XYZ({
						// 	url:'http://t0.tianditu.gov.cn/vec_w/wmts?SERVICE=WMTS&REQUEST=GetTile&VERSION=1.0.0&LAYER=vec&STYLE=default&TILEMATRIXSET=w&FORMAT=tiles&TILEMATRIX={z}&TILEROW={y}&TILECOL={x}&tk=053318a29e7ee8be40a0958754cc1827'
						// 	})
						// }),
						// //矢量标记
						// new ol.layer.Tile({
						// 	source: new ol.source.XYZ({
						// 	url:'http://t0.tianditu.gov.cn/cva_w/wmts?SERVICE=WMTS&REQUEST=GetTile&VERSION=1.0.0&LAYER=cva&STYLE=default&TILEMATRIXSET=w&FORMAT=tiles&TILEMATRIX={z}&TILEROW={y}&TILECOL={x}&tk=053318a29e7ee8be40a0958754cc1827'
						// 	})
						// }),


					],
					target: "olMap",
					view: new ol.View({
						// center: ol.proj.fromLonLat([0, 0]),
						projection: "EPSG:4326", //使用这个坐标系
						center: [104, 30], //初始坐标
						zoom: 1,
						minZoom: 1,
						maxZoom: 17
					})
				})

				//实例化Vector要素,通过矢量图层添加到地图容器中
				let iconFeature = new ol.Feature({
						geometry: new ol.geom.Point([104, 30])
				});
				// iconFeature.setStyle(createLabelStyle(iconFeature));
				iconFeature.setStyle(
				new ol.style.Style({
					/**{olx.style.IconOptions}类型*/
					image: new ol.style.Icon(
							({
									anchor: [0.5, 60],
									anchorOrigin: 'top-right',
									anchorXUnits: 'fraction',
									anchorYUnits: 'pixels',
									offsetOrigin: 'top-right',
									// offset:[0,10],
									//图标缩放比例
									// scale:0.5,
									//透明度
									opacity: 0.75,
									//图标的url
									src: '/static/image/1.png'
							})
							)


				})
				);
				//矢量标注的数据源
				let	vectorSource = new ol.source.Vector({
						features: [iconFeature]
				});

				//矢量标注图层
				let vectorLayer = new ol.layer.Vector({
						source: vectorSource
				});
				this.map.addLayer(vectorLayer);

				this.map.on('click', function(evt) {

					let point = evt.coordinate;
					console.log(point)

					//新建一个要素 ol.Feature
					let newFeature = new ol.Feature({
							//几何信息
							geometry: new ol.geom.Point(point)
					});
					//设置要素的样式
					// newFeature.setStyle(this.createLabelStyle(newFeature));

					newFeature.setStyle(new ol.style.Style({
						/**{olx.style.IconOptions}类型*/
						image: new ol.style.Icon(
								({
										anchor: [0.5, 60],
										anchorOrigin: 'top-right',
										anchorXUnits: 'fraction',
										anchorYUnits: 'pixels',
										offsetOrigin: 'top-right',
										// offset:[0,10],
										//图标缩放比例
										// scale:0.5,
										//透明度
										opacity: 0.75,
										//图标的url
										src: '../../static/image/1.png'
								})
								)
					}));
					//将新要素添加到数据源中
					vectorSource.addFeature(newFeature);
				})
			}
		}
	}
</script>


<style lang="scss">
	@import url("@/static/openLayers6.15/ol.css");

	html,
	body {
		height: 100vh;
		width: 100vw
	}


	#olMap {
		position: relative;
		width: 100vw;
		height: 100vh;
	}
</style>
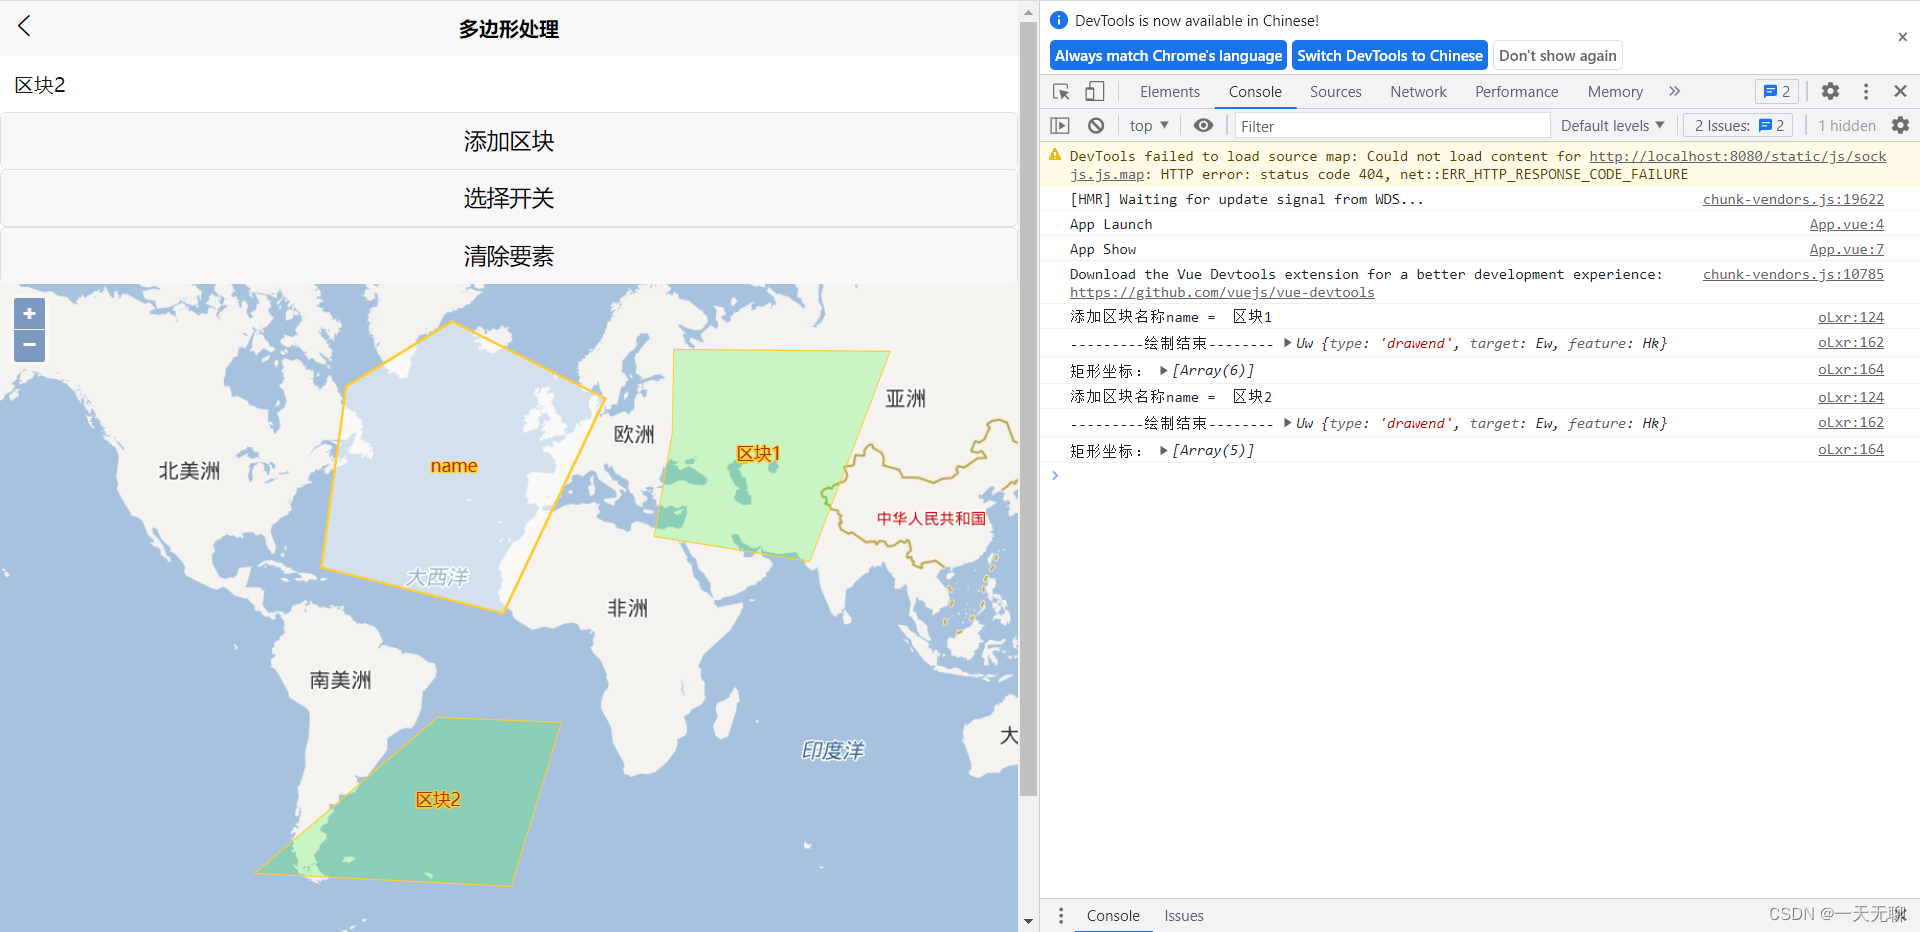
多边形区块添加和清除
效果展示
源代码
<template>
	<view>
		<view>
			<input style="margin: 10rpx;" type="text" :msg="name" :change:msg="ol.getNewPolygonName" v-model="name" placeholder="请输入区块名称"/>
			<button @click="ol.AddPolygonClick">添加区块</button>
			<button @click="ol.openSelect">选择开关</button>
			<button @click="ol.cleanPolygon">清除要素</button>
			    <h1 id="msg"></h1>

			</view>
		<view id="mapCon" style="width: 100%; height: 90%; position: absolute;"></view>
	</view>
</template>

<script>
	export default {
		data() {
			return {
				// 区块名称
				name: ''
			}
		},
		methods: {

		}
	}
</script>

<script module="ol" lang="renderjs">
	export default {
		data() {
			return {
				polygonName: '',  // 区块名称
				map: null, // 地图容器
				draw: null ,	// 画笔
				select: null, // 选择工具
				removeLayer: null, // 删除的Layer
			}
		},
		mounted() {
			// 初始化地图
			if (typeof window.ol === 'function') {
				this.initMap()
			} else {
				const script = document.createElement('script')
				// script.src = 'static/openLayers6.15/ol.js' //可以通过此方式导入jquery,echart库
				script.src = 'https://lib.baomitu.com/ol3/4.6.5/ol.js' //可以通过此方式导入jquery,echart库
				script.onload = this.initMap.bind(this)
				document.head.appendChild(script)
			}

		},
		methods: {
			// 初始化方法
			initMap() {
				// 地图图层
				let TiandiMap_vec = new ol.layer.Tile({
						title: "天地图矢量图层",
						source: new ol.source.XYZ({
								url:'http://t0.tianditu.gov.cn/vec_w/wmts?SERVICE=WMTS&REQUEST=GetTile&VERSION=1.0.0&LAYER=vec&STYLE=default&TILEMATRIXSET=w&FORMAT=tiles&TILEMATRIX={z}&TILEROW={y}&TILECOL={x}&tk=053318a29e7ee8be40a0958754cc1827',
								// 限制图层在X轴方向上重复
								wrapX: false
						})
				});
				let Tianditu_cva = new ol.layer.Tile({
						title: "天地图矢量注记图层",
						source: new ol.source.XYZ({
								url:'http://t0.tianditu.gov.cn/cva_w/wmts?SERVICE=WMTS&REQUEST=GetTile&VERSION=1.0.0&LAYER=cva&STYLE=default&TILEMATRIXSET=w&FORMAT=tiles&TILEMATRIX={z}&TILEROW={y}&TILECOL={x}&tk=053318a29e7ee8be40a0958754cc1827',
								// 限制图层在X轴方向上重复
								wrapX: false
						})
				});

				// 处理百度地图
				//坐标参考系
				var projection = ol.proj.get("EPSG:3857");
				//分辨率
				var resolutions = [];
				for (var i = 0; i < 19; i++) {
						resolutions[i] = Math.pow(2, 18 - i);
				}
				var tilegrid = new ol.tilegrid.TileGrid({
						origin: [0, 0],
						resolutions: resolutions
				});
				//拼接百度地图出图地址
				var baidu_source = new ol.source.TileImage({
						//设置坐标参考系
						projection: projection,
						//设置分辨率
						tileGrid: tilegrid,
						//出图基地址
						tileUrlFunction: function (tileCoord, pixelRatio, proj) {
								if (!tileCoord) {
										return "";
								}
								var z = tileCoord[0];
								var x = tileCoord[1];
								var y = tileCoord[2];

								if (x < 0) {
										x = "M" + (-x);
								}
								if (y < 0) {
										y = "M" + (-y);
								}
								return "http://online3.map.bdimg.com/onlinelabel/?qt=tile&x=" + x + "&y=" + y + "&z=" + z + "&styles=pl&udt=20151021&scaler=1&p=1";
						}
				});
				//百度地图
				var baidu_layer = new ol.layer.Tile({
						source: baidu_source
				});

				// 实例化map对象加载地图
				this.map = new ol.Map({
					// 地图加载容器目标
					target:'mapCon',
					// 加载图层
					layers: [
						baidu_layer
					],
					// 地图视图设置
					view: new ol.View({
						// 地图初始化中心点
						center: [0, 0],
						// 地图初始化显示级别
						zoom: 3,
						projection: "EPSG:3857"
					})

				})
				this.initPolygon();
			},
			// 获取最新区块名称
			getNewPolygonName(newValue, oldValue, ownerVm, vm) {
				// console.log('msg变化了newValue', newValue)
				// console.log('msg变化了oldValue', oldValue)
				// console.log('msg变化了ownerVm', ownerVm)
				// console.log('msg变化了vm', vm)
				this.polygonName = newValue
				// console.log('---------获取最新区块名称:',this.polygonName)
			},
			// 添加区块
			AddPolygonClick() {

				console.log('添加区块名称name = ',this.polygonName)
				// 为每一个区块创建源及图层,方便以后的删除操作
				let source = new ol.source.Vector({wrapX: false});
				let lineLayer = new ol.layer.Vector({
					source: source,
					// 样式
					style: new ol.style.Style({
						// 填充
						fill: new ol.style.Fill({
							color: 'rgba(27, 255, 24, 0.2)'
						}),
						// 线
						stroke: new ol.style.Stroke({
							color: '#ffcc33',
							widht: 2
						}),
						image: new ol.style.Circle({
							radius: 7,
							fill: new ol.style.Fill({
								color: '#ffcc33'
							})
						})
					})
				})
				this.map.addLayer(lineLayer)
				// 清空旧画笔
				this.map.removeInteraction(this.draw)
				this.draw = new ol.interaction.Draw({
					source: source,
					type: 'Polygon'
				})
				// 添加交互画笔
				this.map.addInteraction(this.draw)
				// 绘制结束后处理事件
				let that = this
				this.draw.on('drawend', function (e) {
					console.log('---------绘制结束--------', e)
					var coordinates_Polygon = e.feature.getGeometry().getCoordinates();
					console.log('矩形坐标:',coordinates_Polygon)
					// 绘制结束,清空旧画笔
					that.map.removeInteraction(that.draw)
					// 添加区块描述
					//新建一个要素 ol.Feature
					let newFeature = new ol.Feature({
							//几何信息
							geometry: new ol.geom.Polygon(
								coordinates_Polygon
							),
							//名称属性
							name: that.polygonName
					});

					//设置要素的样式
					newFeature.setStyle(new ol.style.Style({
								text: new ol.style.Text({
										//位置
										textAlign: 'center',
										//基准线
										textBaseline: 'middle',
										//文字样式
										font: 'normal 14px 微软雅黑',
										//文本内容
										text: newFeature.get('name'),
										//文本填充样式(即文字颜色)
										fill: new ol.style.Fill({ color: '#aa3300' }),
										stroke: new ol.style.Stroke({ color: '#ffcc33', width: 2 })
								})
						})
					);
					// 为图层添加文字描述要素
					lineLayer.getSource().addFeature(newFeature)
					// ==============区块数据保存================
					// 坐标数组: coordinates_Polygon
					// 区块名称: this.polygonName
				})


			},
			// 选择工具开关
			openSelect() {
				console.log("----------选择工具开关----------")
				// 创建选择工具
				this.select = new ol.interaction.Select({
					multi: false //单选
				});

				console.log('this.select', this.select)
				let that = this
				// 监听select事件
				this.select.on('select', function (e) {
						if (e.selected.length > 0) {
								var feature = e.selected[0];
								var name = feature.get('name');
								console.log('选中的要素名:', name)
								// 获取所有图层
								var layers = that.map.getLayers().getArray();
								// 找到 Feature 对应的 Layer
								 for(var i=0;i<layers.length;i++){
										 var source = layers[i].getSource();
										 if(source instanceof ol.source.Vector){
												var features = source.getFeatures();
												if(features.length>0){
														for(var j=0;j<features.length;j++){
															if(features[j]===feature){
																console.log('layer = ',layers[i])
																// 保存要删除的 Layer
																that.removeLayer = layers[i]
															}
													 }
												}
										 }
								 }


						}
				});

				// 添加单选工具
				this.map.addInteraction(this.select);


			},
			// 清除区块数据
			cleanPolygon() {
				console.log("----------执行 clean ----------")
				console.log('removeLayer:',this.removeLayer)
				this.map.removeLayer(this.removeLayer)
				// 停止选中
				this.map.removeInteraction(this.select)
			},
			// 区块初始化
			initPolygon() {
				//实例化一个矢量图层Vector作为绘制层
				var source = new ol.source.Vector({
					wrapX: false
				});
				//创建一个图层
				var vector = new ol.layer.Vector({
						source: source
				});

				// 创建区块
				var Polygon = new ol.Feature({
						geometry: new ol.geom.Polygon([
							[
							    [
							        -6680473.853446292,
							        8081534.126535117
							    ],
							    [
							        -7463189.023086497,
							        2414676.776071461
							    ],
							    [
							        -1765022.468672948,
							        974480.8639334813
							    ],
							    [
							        1428455.662324801,
							        7705830.128510676
							    ],
							    [
							        -3361760.937007539,
							        10116593.08986822
							    ],
							    [
							        -6680473.853446292,
							        8081534.126535117
							    ]
							]
						])
				});
				//设置区样式信息
				Polygon.setStyle(new ol.style.Style({
						//填充色
						fill: new ol.style.Fill({
								color: 'rgba(255, 255, 255, 0.5)'
						}),
						//边线颜色
						stroke: new ol.style.Stroke({
								color: '#ffcc33',
								width: 2
						}),
						//形状
						image: new ol.style.Circle({
								radius: 7,
								fill: new ol.style.Fill({
										color: '#ffcc33'
								})
						})
				}));

				//新建一个要素 ol.Feature
				let newFeature = new ol.Feature({
						//几何信息
						geometry: new ol.geom.Polygon([
							[
							    [
							        -6680473.853446292,
							        8081534.126535117
							    ],
							    [
							        -7463189.023086497,
							        2414676.776071461
							    ],
							    [
							        -1765022.468672948,
							        974480.8639334813
							    ],
							    [
							        1428455.662324801,
							        7705830.128510676
							    ],
							    [
							        -3361760.937007539,
							        10116593.08986822
							    ],
							    [
							        -6680473.853446292,
							        8081534.126535117
							    ]
							]
						]),
						//名称属性
						name: 'name'
				});
				//设置要素的样式
				newFeature.setStyle(new ol.style.Style({
							text: new ol.style.Text({
									//位置
									textAlign: 'center',
									//基准线
									textBaseline: 'middle',
									//文字样式
									font: 'normal 14px 微软雅黑',
									//文本内容
									text: newFeature.get('name'),
									//文本填充样式(即文字颜色)
									fill: new ol.style.Fill({ color: '#aa3300' }),
									stroke: new ol.style.Stroke({ color: '#ffcc33', width: 2 })
							})
					})
				);
				//将新要素添加到数据源中
				source.addFeature(newFeature);
				source.addFeature(Polygon);


				//将绘制层添加到地图容器中
				this.map.addLayer(vector);
			}


		}
	}
</script>

<style>
@import url("https://lib.baomitu.com/ol3/4.6.5/ol.css");
</style>


 4820
4820


 被折叠的 条评论
为什么被折叠?
被折叠的 条评论
为什么被折叠?
 到【灌水乐园】发言


