


昨天收到题,我真是傻眼,因为首先,我不懂图像处理,其次,我不会用python的画图工具,matlab更是不用想了,同学告诉我11个G,弄好要好几天。
但是题倒是不难,所以我开始:
1.下载pycharm,用的试用版,破解感觉好麻烦,有时间再搞。
2.装brew,装python3,这里配环境又搞我心态,我觉得重装的系统也不怎么地啊,source命令都有问题。
3.pip 一大堆包,最重要的是matplotlib和cv2。这里要用清华的镜像源,否则出现超时错误
-i https://pypi.tuna.tsinghua.edu.cn/simple
改为永久配置
pip install pip -U
pip config set global.index-url https://pypi.tuna.tsinghua.edu.cn/simple
4.开始写代码。网上没有原题,但是我找到了一个遍历像素的参考,加上一个判断素数的函数。灰度值是一个三位数组,数组里每个值都相同,所以我把第一个值抽出来,判断是否是素数,如果是,就加入列表。
5.按照网上的matploblib参考资料画图,用hist函数,得到频数直方图,bins参数代表有多少个立柱。
6.一开始读图片总错,找了一个小时,发现路径最后多了一个空格~
总之,林林总总,也花了我7.8个小时时间,现在画出来的图还是有问题,为什么有这么多0呢,0从哪来的。
代码如下:
import numpy as np
import matplotlib.pyplot as plot
import cv2

img = cv2.imread('/Users/apple/Desktop/timg.jpg', 1)
try:
    img.shape
except:
    print("can not read the image")


# 判断素数
def is_prime(n):
    if n == 1 or n == 0:
        return False
    for x in range(2, n):
        if n % x == 0:
            return False
    return True


# 遍历每个元素
img1 = np.copy(img)
rows, cols = img1.shape[:2]
i = 0
my_list = []
for row in range(rows):
    for col in range(cols):
        if (is_prime(img[row, col][1])):
            my_list.insert(i, img[row, col][1])
            i = i + 1

plot.figure()
plot.hist(my_list,bins =250)
plot.grid(alpha=0.5,linestyle='-.')
plot.xlabel('Prime gray value')
plot.ylabel('Number of pixels')
plot.title('Prime gray value of events')
plot.show()
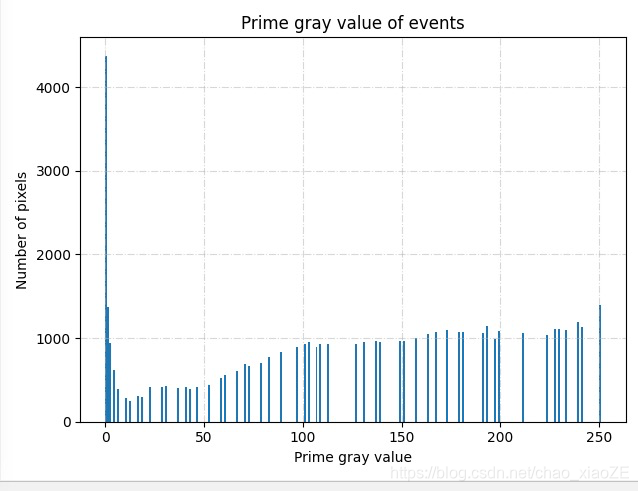
睡一觉醒来,发现自己求素数的函数里没定义0啊哈哈哈。
收工,交作业。


 2865
2865


 被折叠的 条评论
为什么被折叠?
被折叠的 条评论
为什么被折叠?
 到【灌水乐园】发言


