


worldometer是一个全球网站,在这里可以查看全球新冠肺炎最新疫情。于是我写了一个Python程序,可以从这个网站获取指定国家的疫情数据并写入数据库。
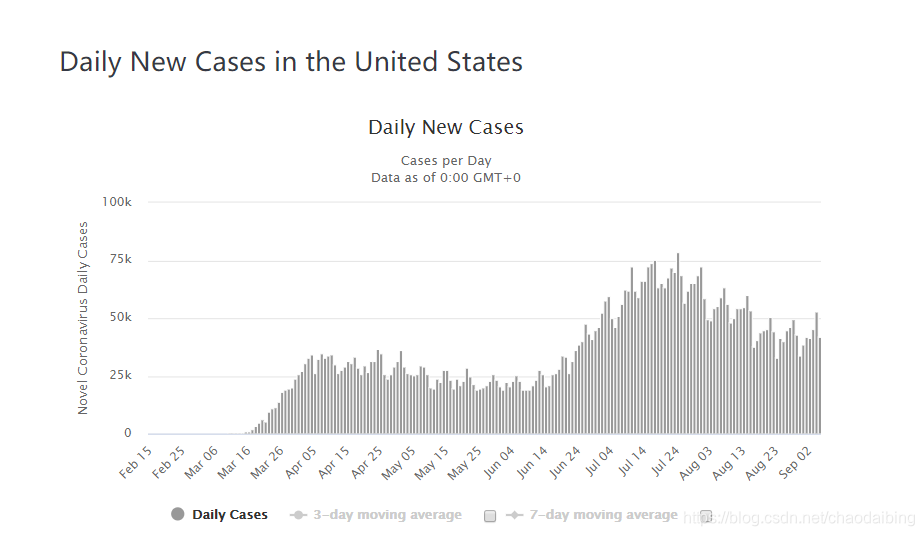
数据源就是这些图表数据
代码如下。
第一步:从外网获取疫情数据,写入到mysql,注意最好用电信的网络
需要安装 pip install pandas sqlalchemy requests
这一步每天都需要执行一次,以更新数据。
#-*- coding:utf-8 -*-
import requests,time,datetime
import tkinter as tk #使用Tkinter前需要先导入
from tkinter import filedialog,messagebox,ttk
import pandas as pd
import matplotlib.pyplot as plt
from sqlalchemy import create_engine

plt.rcParams['font.sans-serif']=['SimHei']
conn=create_engine("mysql+pymysql://root:pass@127.0.0.1:3306/dbname")
window = tk.Tk()                     #国家列表
indexlist=['新增病例数','新增死亡数','现有病例数','累计病例数','累计死亡数']      #疫情指标列表
typemap={'线形图':'line','柱状图':'bar'}
window.title('疫情曲线图')
w_width=700
w_height=700

scn_width=window.maxsize()[0]
x_point=(scn_width-w_width)//2

window.geometry('%dx%d+%d+%d' %(w_width,w_height,x_point,100))
#window.wm_attributes('-topmost',True)
window.tk_focusFollowsMouse()
window.bind("<Escape>",lambda event:window.iconify())

#更新疫情数据
def updatedate():
  headers = {
    "User-Agent": "Mozilla/5.0 (Windows NT 6.1; WOW64) AppleWebKit/537.36 (KHTML, like Gecko) Chrome/53.0.2785.143 Safari/537.36",
    "Referer": "https://www.worldometers.info/coronavirus/#countries"               #网址
  }
  cols=['date','新增病例数','新增死亡数','现有病例数','累计病例数','累计死亡数']  #字段
  #要统计的国家列表
  sql="select country_p,country_cn from countrylist where country_p is not null and country_cn not in (select country from pandemic where date='{}') order by region,pinyin"
  yesterday=(datetime.datetime.now()-datetime.timedelta(days=1.4)).strftime('%Y-%m-%d') #1.4天前
  sql=sql.format(yesterday)
  dfc=pd.read_sql(sql,conn)       #只统计没有昨日数据的国家
  countrymap=dict(zip(dfc['country_p'],dfc['country_cn'])) #英文中文对照
  t1=time.time()
  conn.execute('truncate table temp')   #清空临时表
  addones=" ".join(countrymap.values())
  for country in countrymap:
    url='https://www.worldometers.info/coronavirus/country/'+country  #数据来源网址
    print(url)
    try:      #防止超时报错
      res=requests.get(url,headers=headers,timeout=6)
      res=res.content.decode('utf-8')
    except Exception as e:        #发生超时的国家则跳过
      print(country,end=":")
      print(e)
      continue
    res=res.replace('\n','')
    #获取日期列表
    res1=res.split('Total Deaths')[1].split('yAxis')[0].split('categories')[1].split(':')[1].split('}')[0]
    datelist=eval(res1)
    #新增病例
    res2=res.split("name: 'Daily Cases'")[1].split('{')[0].split('data')[1].split(':')[1].split('}')[0].replace('null','0')
    new_case_list=eval(res2)
    #新增死亡
    try:
      res3=res.split("name: 'Daily Deaths'")[1].split('{')[0].split('data')[1].split(':')[1].split('}')[0].replace('null','0')
      new_death_list=eval(res3)
    except Exception as e:
      print(e)
      new_death_list=len(datelist)*[0]
    #现有病例   一些国家数据缺失所以要try
    try:
      res4=res.split("name: 'Currently Infected'")[1].split('{')[0].split('data')[1].split(':')[1].split('}')[0].replace('null','0')
      current_case_list=eval(res4)
    except Exception as e:
      print(e)
      current_case_list=len(datelist)*[0]
    #累计病例
    res5=res.split("name: 'Cases'")[1].split('{')[0].split('data')[1].split(':')[1].split('}')[0].replace('null','0')
    total_case_list=eval(res5)
    #累计死亡
    res6=res.split("name: 'Deaths'")[1].split('{')[0].split('data')[1].split(':')[1].split('}')[0].replace('null','0')
    total_death_list=eval(res6)
    #数据整合
    data=list(zip(datelist,new_case_list,new_death_list,current_case_list,total_case_list,total_death_list))
    df=pd.DataFrame(data,columns=cols)    #一国数据
    df['country']=countrymap[country]     #国家为中文
    df['date']=pd.to_datetime(df['date']).astype(str)
    df.to_sql(name='temp',con=conn,if_exists='append',index=False)  #把需要更新的国家添加到临时表
    print('---------------------------done------------------------------------------------')
    time.sleep(0.5)

  conn.execute('replace into pandemic select * from temp')      #只更新需要更新的国家
  t2=time.time()
  messagebox.showinfo('提示',"疫情数据更新完成,耗时{}秒".format(t2-t1)+"\n新增国家:"+addones)
#读取疫情数据出图
def getdata():
  indicator=var.get()                       #疫情的指标
  kind=type.get()
  start_date=startdate.get()
  if start_date:
    start_date=pd.to_datetime(start_date).strftime('%Y-%m-%d')
  end_date=enddate.get()
  if end_date:
    end_date=pd.to_datetime(end_date).strftime('%Y-%m-%d')
  chosed=[i.get() for i in v if i.get()]    #选择的国家
  dfa=[]
  dateoption=""
  if(start_date and end_date):
    dateoption="and date between '{}' and '{}'".format(start_date,end_date)
  elif(start_date):
    dateoption="and date>'{}'".format(start_date)
  elif(end_date):
    dateoption="and date<'{}'".format(end_date)
  else:
    dateoption=""
  for country in chosed:
    sql="select date 日期,{indicator} as {country} from pandemic where country='{country}' and date>='2020-02-15' ".format(country=country,indicator=indicator)
    sql+=dateoption
    dfx=pd.read_sql(sql,conn)
    dfx.set_index('日期',inplace=True)
    dfx=dfx
    dfa.append(dfx)

  dff=pd.concat(dfa,axis=1)       #聚合结果
  dff.reset_index(inplace=True)
  dff['日期']=dff['日期'].apply(lambda x:x[5:])
  dff.set_index('日期',inplace=True)
  dff.plot(kind=typemap[kind],title=indicator+'') #出图
  plt.grid(axis='y',linestyle='dotted', color='red')
  plt.show()
#反选
def unselectall():
  for index,item in enumerate(countrylist):
    v[index].set('')
#全选
def selectall():
  for index,item in enumerate(countrylist):
    v[index].set(item)

frame0=tk.Frame(window,pady=10,padx=15)
frame0.grid(row=0,column=0,sticky='w')
ttk.Button(frame0,text="点击更新疫情数据",command=updatedate).grid(row=0,column=0,sticky='w')

frame1=tk.Frame(window,pady=10,padx=15)
frame1.grid(row=1,column=0)
#全选反选
opt=tk.IntVar()
ttk.Radiobutton(frame1,text='全选',variable=opt,value=1,command=selectall).grid(row=0,column=0,sticky='w')
ttk.Radiobutton(frame1,text='反选',variable=opt,value=0,command=unselectall).grid(row=0,column=1,sticky='w')
#勾选国家
dfc=pd.read_sql("select country_cn from countrylist where country_p is not null order by region,pinyin",conn)
countrylist=dfc['country_cn'].tolist()
v=[]
for index,item in enumerate(countrylist):
  v.append(tk.StringVar())
  ttk.Checkbutton(frame1,text=item,variable=v[-1],onvalue=item,offvalue="").grid(row=index//6+1,column=index%6,sticky='w')

frame2=tk.Frame(window,padx=15,pady=15)
frame2.grid(row=2,column=0,sticky='w')
var=tk.StringVar()
type=tk.StringVar()

daydelta=datetime.timedelta(days=1)
now=datetime.datetime.now()
stamp=now-100*daydelta        #30天前
startdate=tk.StringVar()
startdate.set(stamp.strftime('%Y-%m-%d'))
enddate=tk.StringVar()
enddate.set(now.strftime('%Y-%m-%d'))

ttk.Label(frame2,text="请选择指标:").grid(row=0,column=0,sticky='w')
chosen=ttk.Combobox(frame2,textvariable=var)
chosen.grid(row=0,column=1,sticky='w')
chosen['values']=indexlist
chosen.current(0)

ttk.Label(frame2,text="请选择图类型:").grid(row=1,column=0,sticky='w',pady=3)
chosen=ttk.Combobox(frame2,textvariable=type)
chosen.grid(row=1,column=1,sticky='w')
chosen['values']=['线形图','柱状图']
chosen.current(0)   #默认是第一个

ttk.Label(frame2,text="开始日期:").grid(row=2,column=0,sticky='w')
ttk.Entry(frame2,textvariable=startdate).grid(row=2,column=1,sticky='w')
ttk.Label(frame2,text="结束日期:").grid(row=2,column=2,sticky='w')
ttk.Entry(frame2,textvariable=enddate).grid(row=2,column=3,sticky='w')

ttk.Button(frame2,text="点击获取曲线图",command=getdata).grid(row=3,column=0,pady=3)
window.mainloop()
效果如图:


 416
416


 被折叠的 条评论
为什么被折叠?
被折叠的 条评论
为什么被折叠?
 到【灌水乐园】发言


