


Elasticsearch 系列文章
1、介绍lucene的功能以及建立索引、搜索单词、搜索词语和搜索句子四个示例实现
2、Elasticsearch7.6.1基本介绍、2种部署方式及验证、head插件安装、分词器安装及验证
3、Elasticsearch7.6.1信息搜索示例(索引操作、数据操作-添加、删除、导入等、数据搜索及分页)
4、Elasticsearch7.6.1 Java api操作ES(CRUD、两种分页方式、高亮显示)和Elasticsearch SQL详细示例
5、Elasticsearch7.6.1 filebeat介绍及收集kafka日志到es示例
6、Elasticsearch7.6.1、logstash、kibana介绍及综合示例(ELK、grok插件)
7、Elasticsearch7.6.1收集nginx日志及监测指标示例
8、Elasticsearch7.6.1收集mysql慢查询日志及监控
9、Elasticsearch7.6.1 ES与HDFS相互转存数据-ES-Hadoop
文章目录
本文简单的介绍了通过filebeat收集nginx日志并监控nginx的运行状态。
本文依赖es环境好用、nginx环境正常。
本文分为2个部分,即收集日志到es和检测nginx运行情况。
一、收集nginx日志
1、直接通过filebeat采集日志到ES
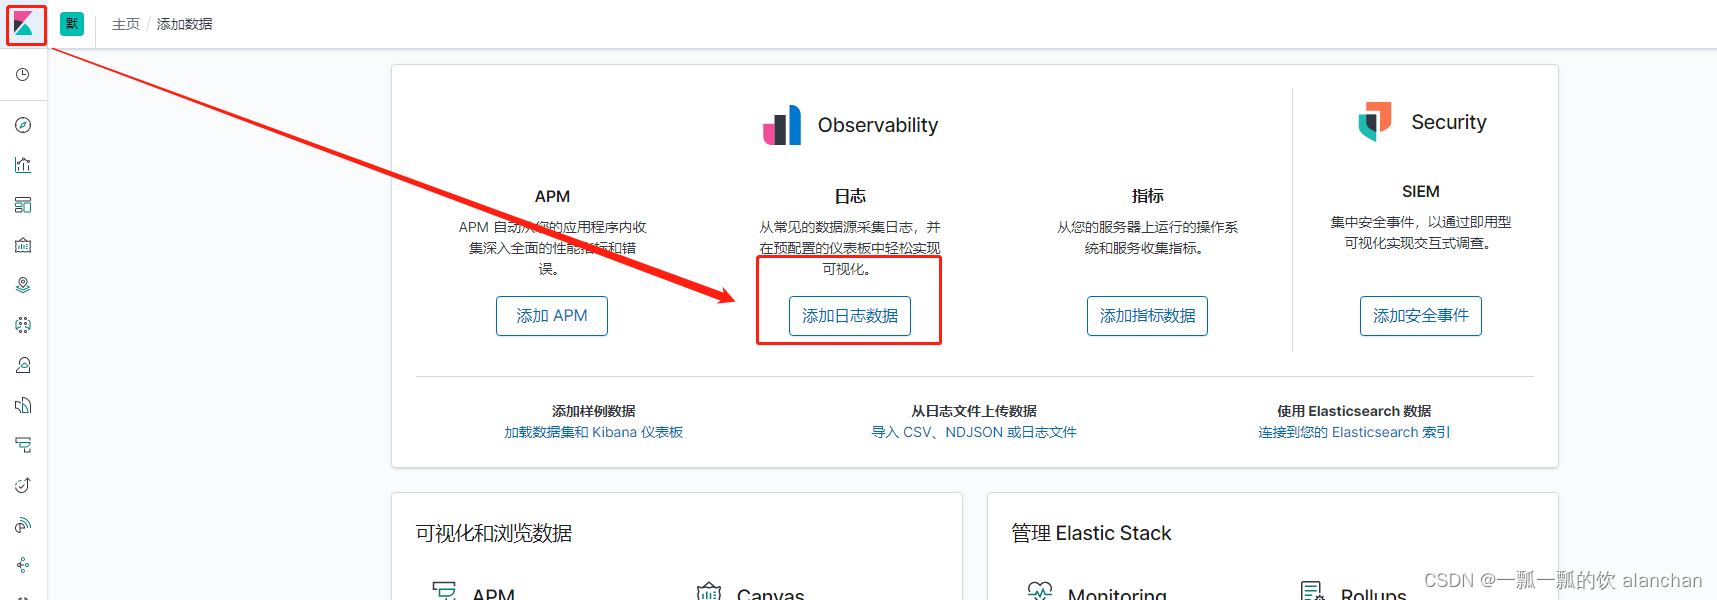
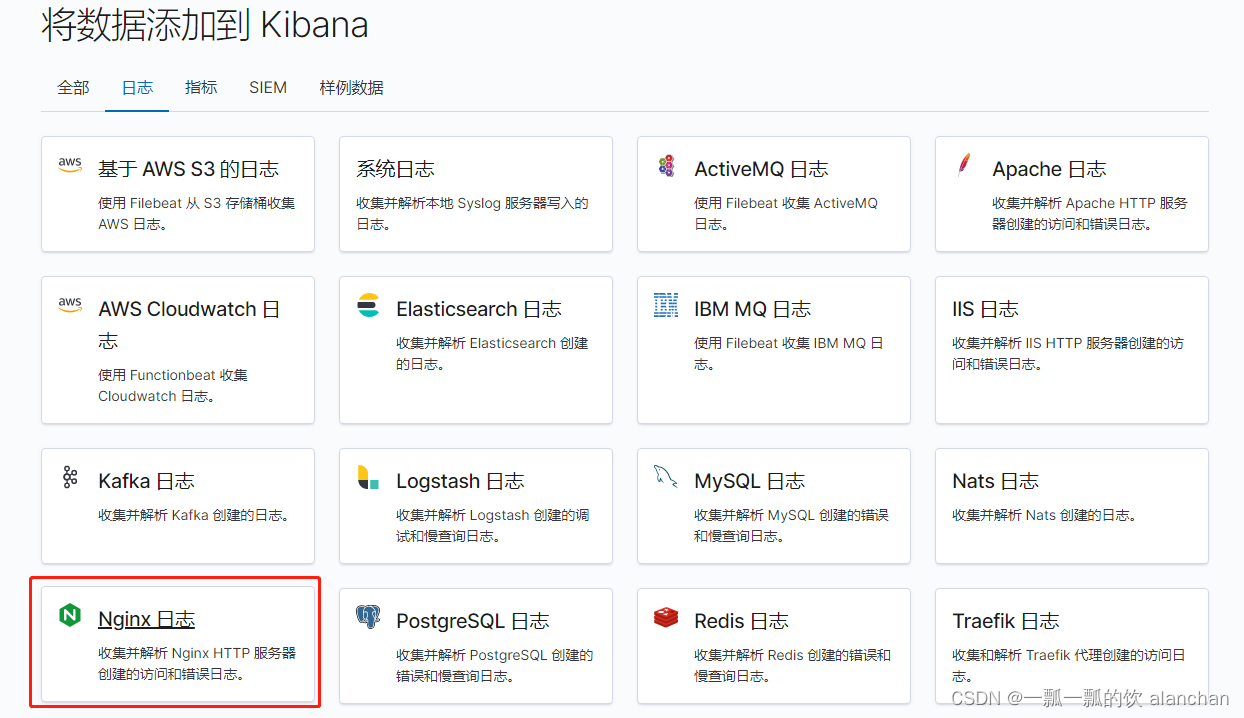
按照步骤一步一步的做即可了。
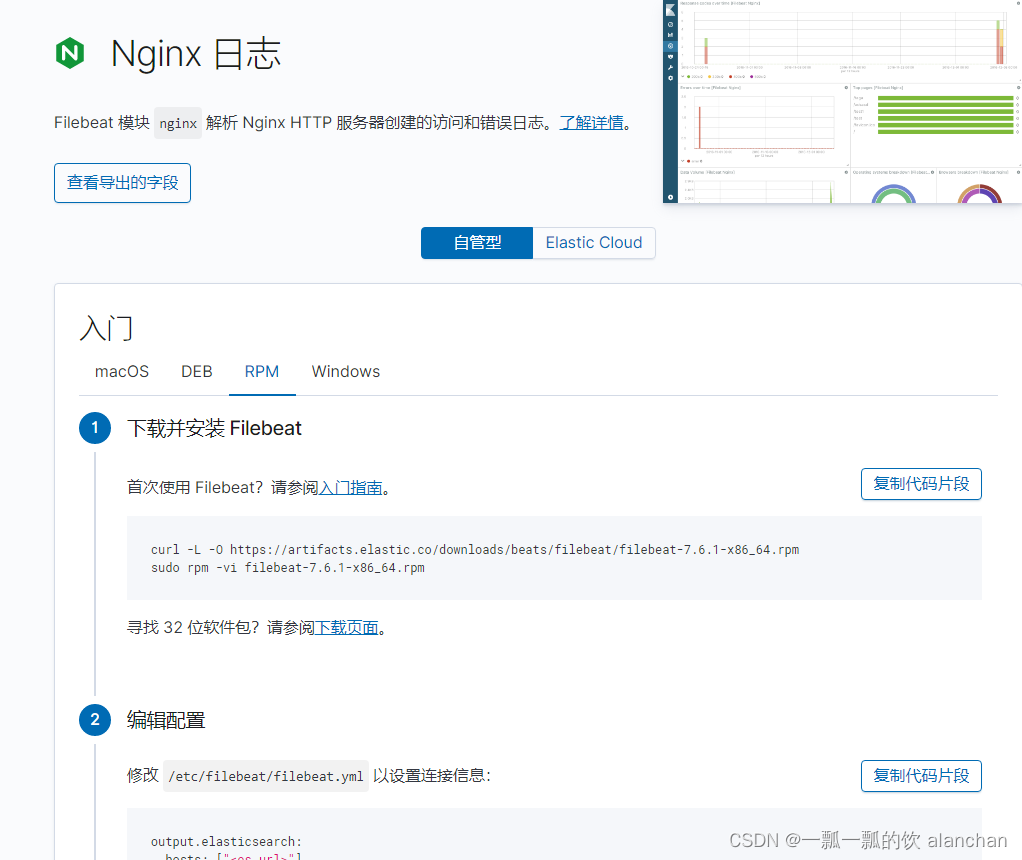
1)、下载filebeat并安装
略
2)、修改配置filebeat.yml
output.elasticsearch:
  hosts: ["server1:9200" ,"server2:9200" ,"server3:9200"]
  #设置了用户名密码就配置
  username: "elastic"
  password: "<password>"
setup.kibana:
  host: "server1:5601"
#该配置文件在/opt/filebeat-7.6.1-linux-x86_64目录下
3)、启用和配置 nginx 模块并修改nginx.yml
执行命令:
filebeat modules enable nginx
执行完成后,/opt/filebeat-7.6.1-linux-x86_64/modules.d目录下生成一个nginx.yml文件
修改后的文件内容如下:
# Module: nginx
# Docs: https://www.elastic.co/guide/en/beats/filebeat/7.6/filebeat-module-nginx.html

- module: nginx
  # Access logs
  access:
    enabled: true

    # Set custom paths for the log files. If left empty,
    # Filebeat will choose the paths depending on your OS.
    var.paths: ["/opt/nginx/logs/access.*"]

  # Error logs
  error:
    enabled: true

    # Set custom paths for the log files. If left empty,
    # Filebeat will choose the paths depending on your OS.
    var.paths: ["/opt/nginx/logs/error.*"]
4)、启动 Filebeat
filebeat setup
service filebeat start
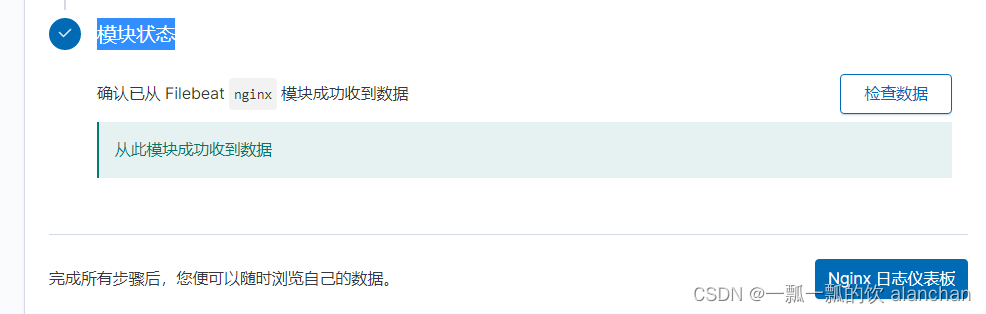
5)、模块状态
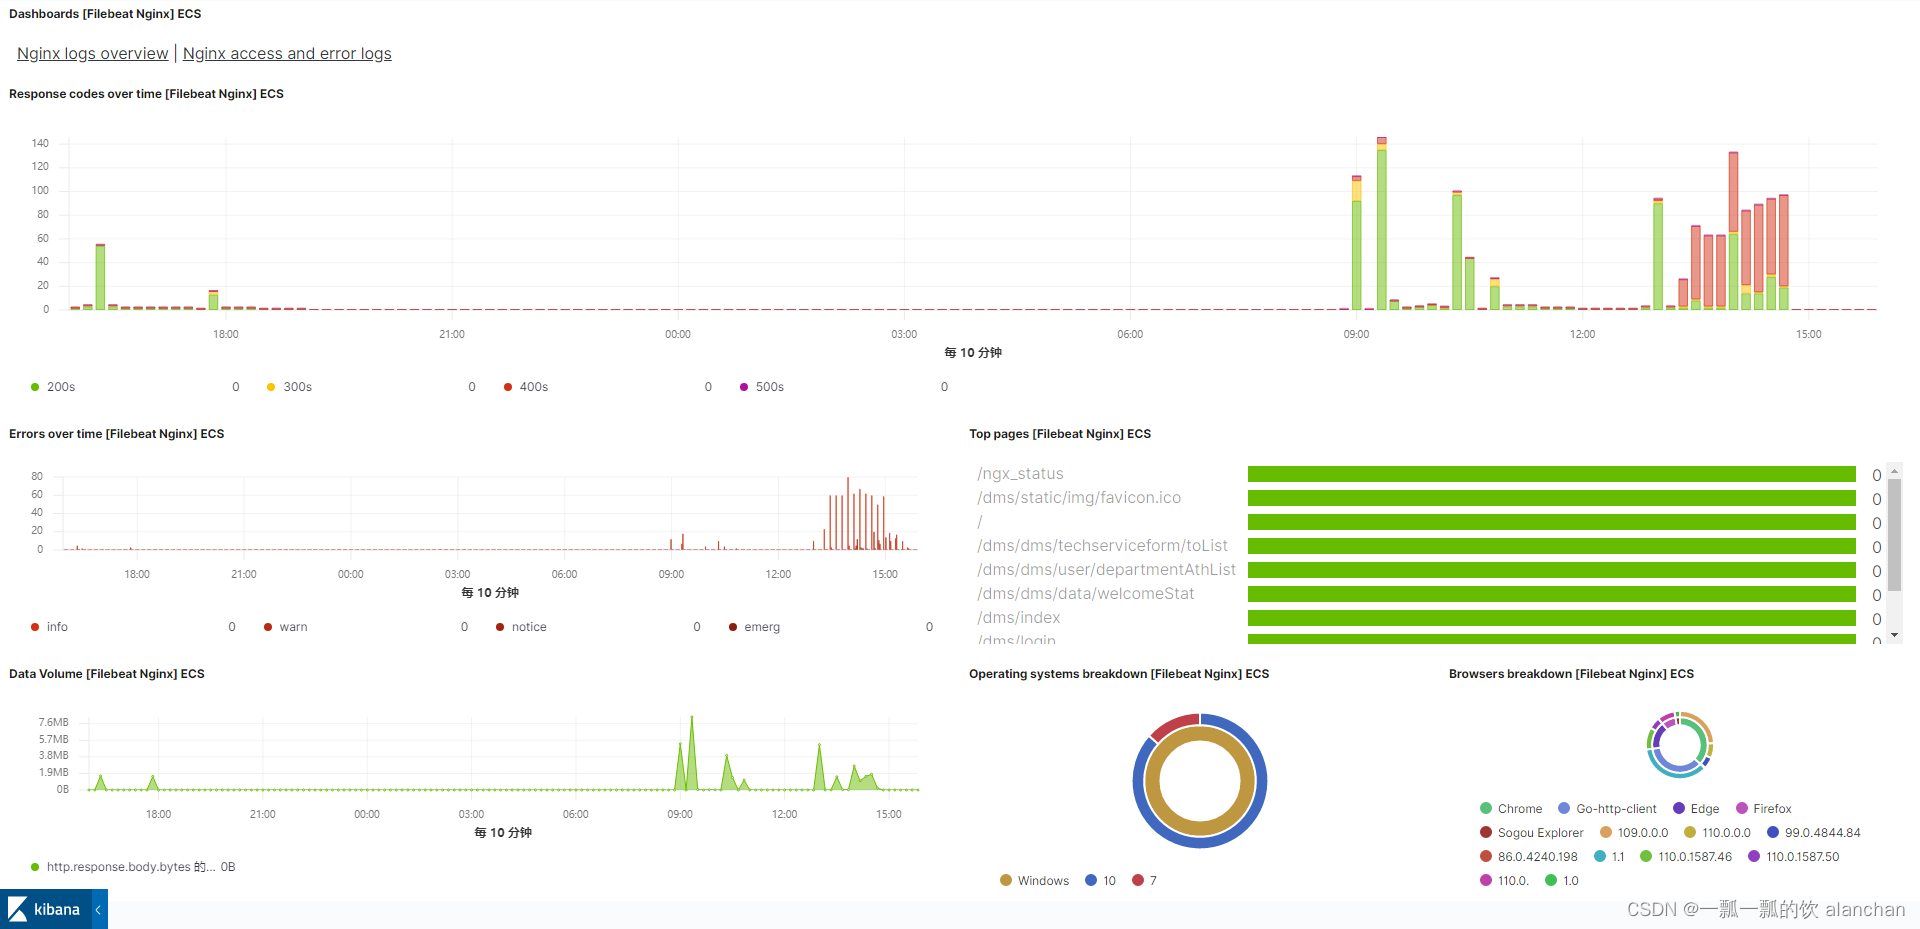
6)、进入nginx日志dashboard
该dashboard可以进行调整,调整后的dashboard(去掉了世界地图)
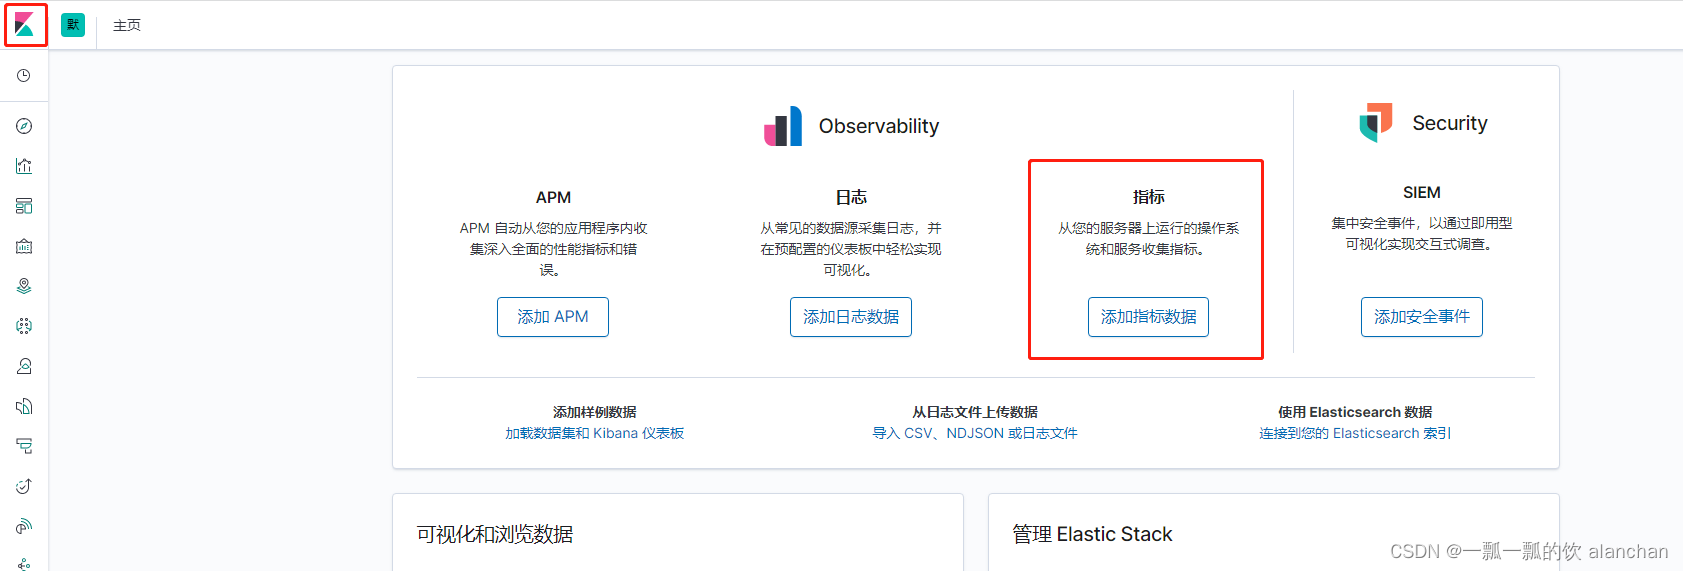
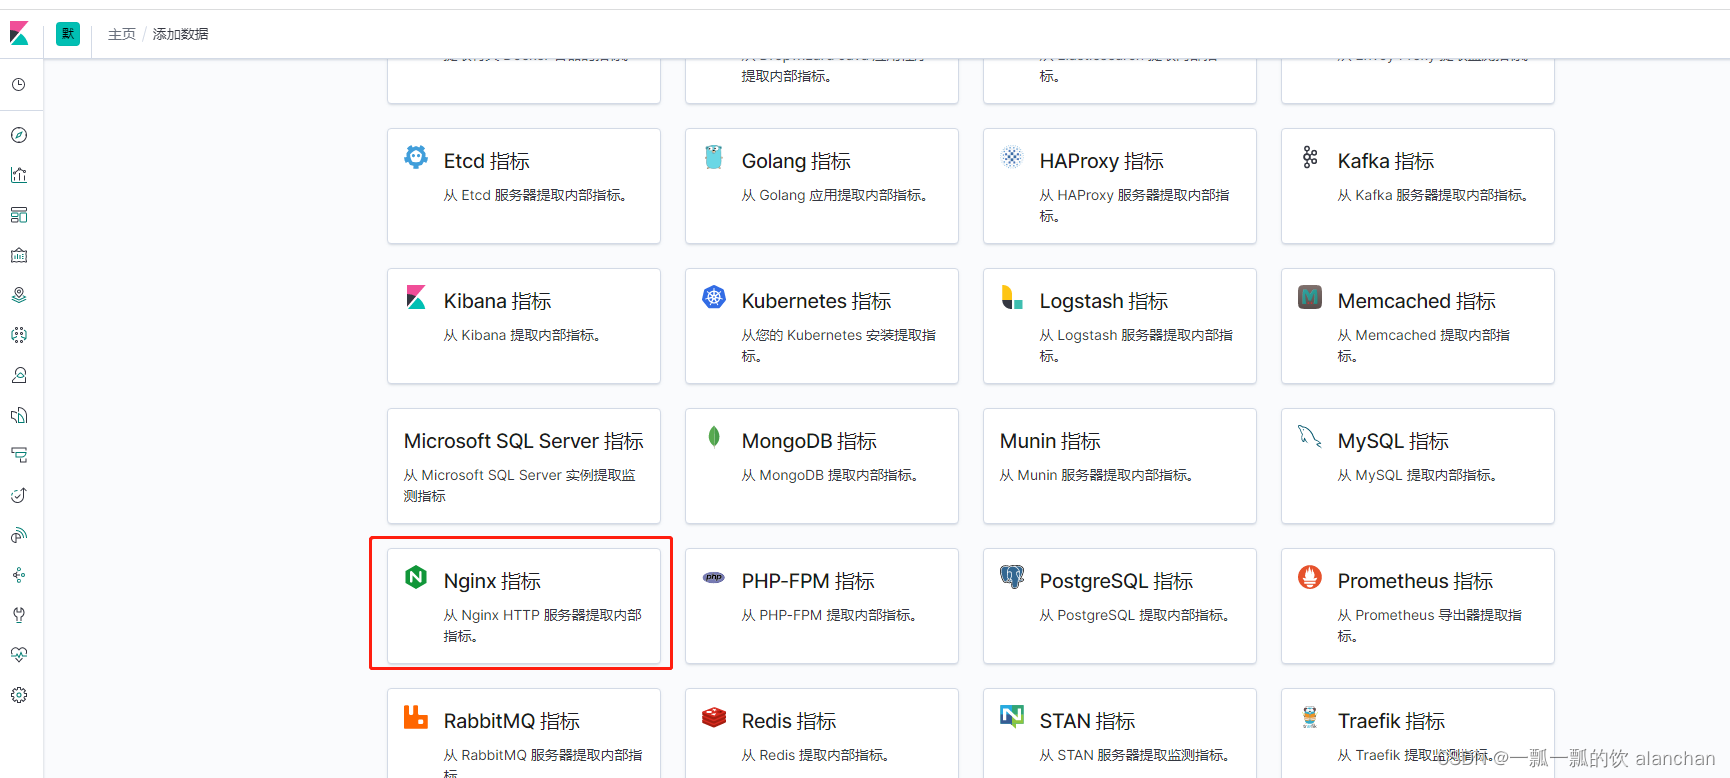
二、监测nginx指标
1、nginx配置
在 Nginx 中相关的状态页面需要通过打开 http_stub_status_module 这个模块获取,在编译 Nginx 时,通过加上–with-http_stub_status_module 进行打开,对应的访问/nginx_status页面就可以获取的 Nginx 的服务状态了。默认nginx是不开启该模块。
Metricbeat nginx模块监控Nginx时,需要启用Nginx的stub_status模块(默认不开启)。
## 1、检查Nginx是否包含了stub_status模块
nginx -V 2>&1 | grep --color -- --with-http_stub_status_module

## 2、在已有的Nginx配置文件(比如//opt/nginx/conf/nginx.conf)的server中添加
  # 开启nginx监控,nginx_status 这个字符串后面有用到,并且需要保持一致
    location /nginx_status {
        stub_status on;
        allow all;
        #allow 127.0.0.1;    #only allow requests from localhost
        #deny all;        #deny all other hosts
     }

## 3、测试Nginx配置
  nginx -t

## 4、重新加载配置文件
nginx -s reload

## 5、测试stub_status

curl http://192.168.10.37/nginx_status
Active connections: 3
server accepts handled requests
 113 113 703
Reading: 0 Writing: 1 Waiting: 2
以上,完成了nginx的监控配置
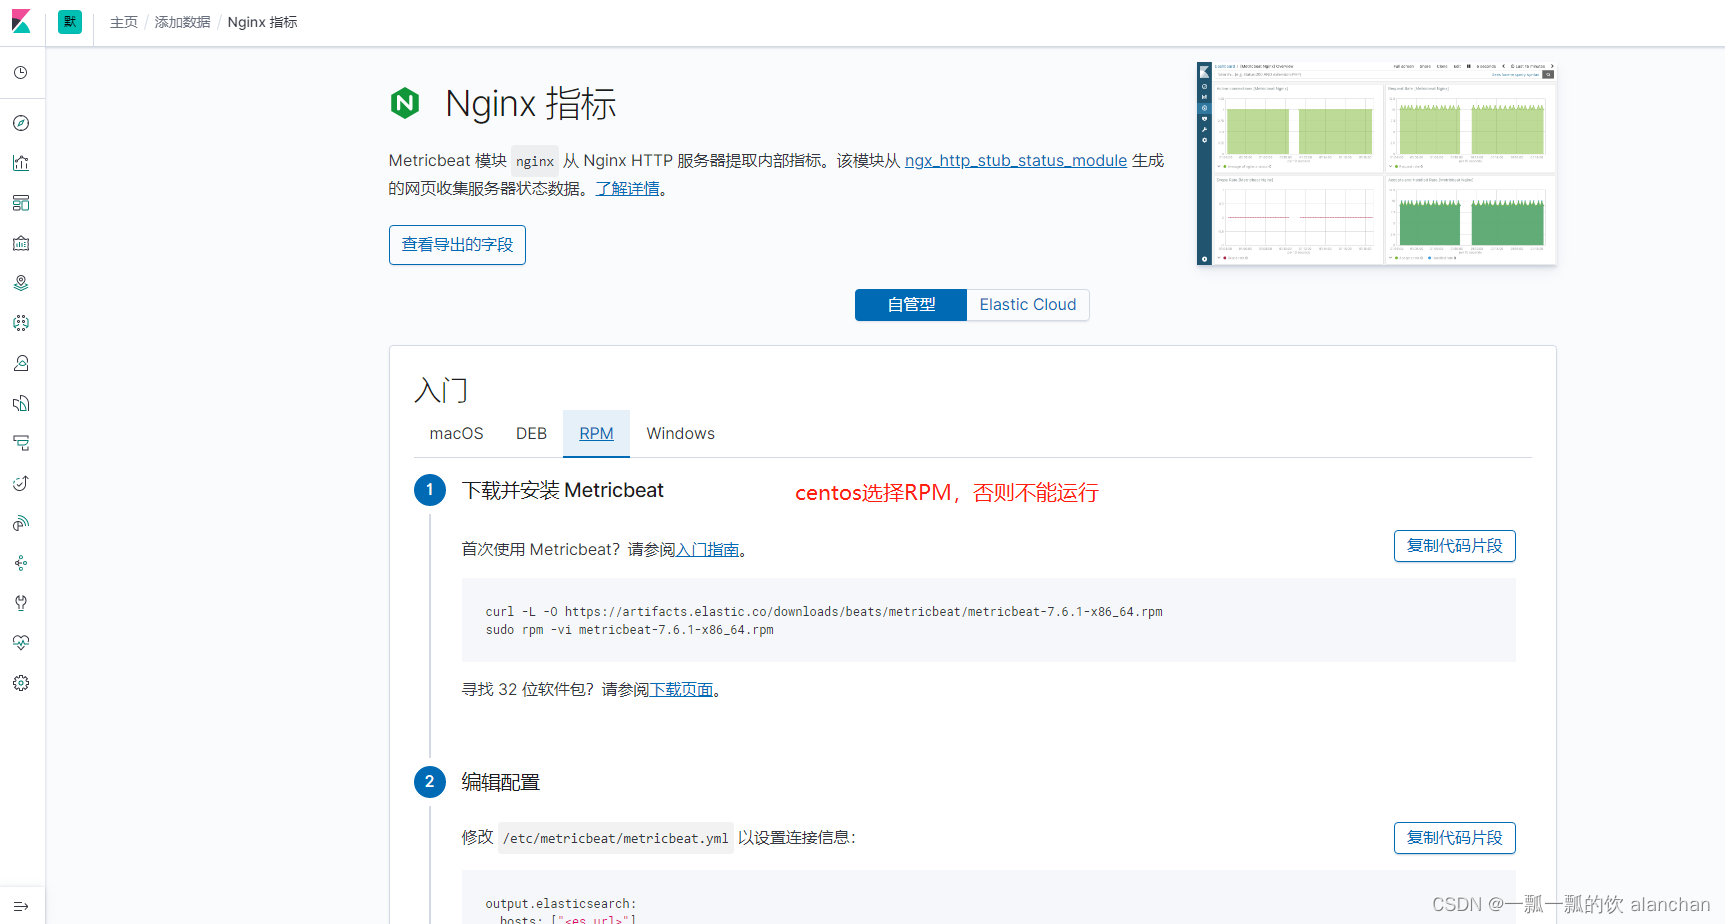
2、下载并安装 Metricbeat
curl -L -O https://artifacts.elastic.co/downloads/beats/metricbeat/metricbeat-7.6.1-x86_64.rpm
rpm -vi metricbeat-7.6.1-x86_64.rpm
默认安装目录是/etc/metricbeat,可以修改为自己的目录
3、编辑配置
修改/etc/metricbeat/metricbeat.yml 以设置连接信息
output.elasticsearch:
  hosts: ["server1:9200" ,"server2:9200" ,"server3:9200"]

  username: "elastic"
  password: "<password>"
setup.kibana:
  host: "server1:5601"
4、启用和配置 nginx 模块并修改其配置
metricbeat modules enable nginx

/etc/metricbeat/modules.d/nginx.yml

# Module: nginx
# Docs: https://www.elastic.co/guide/en/beats/metricbeat/7.6/metricbeat-module-nginx.html

- module: nginx
  metricsets:
    - stubstatus
  enabled: true
  period: 10s

  # Nginx hosts
  hosts: ["http://192.168.10.37:80"]

  # Path to server status. Default server-status
  #注意:server_status_path需要和启用Nginx stub_status模块时设置的location保持一致
  server_status_path: "nginx_status"

  #username: "user"
  #password: "secret"
5、启动 Metricbeat
metricbeat setup
service metricbeat start
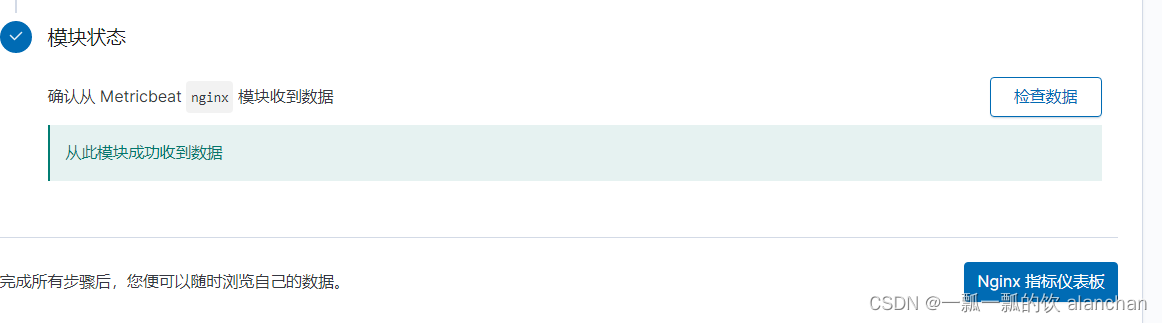
6、模块状态
7、验证
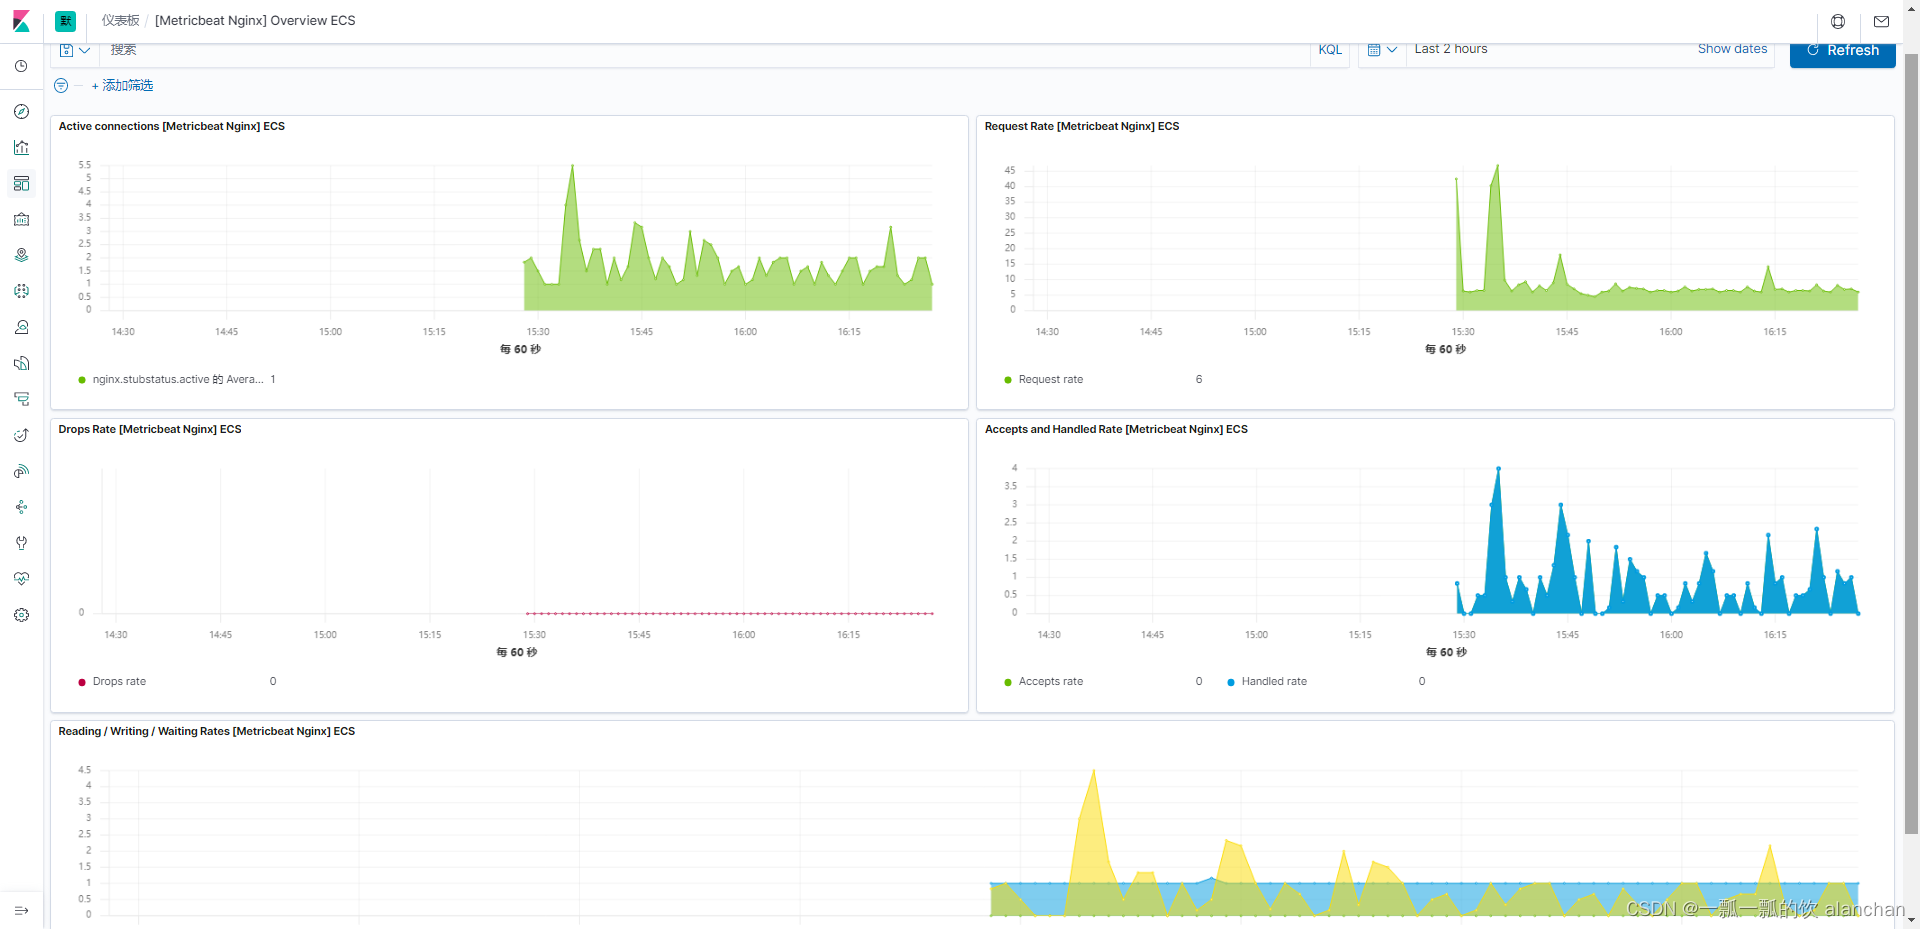
以上,简单的介绍了通过filebeat收集nginx日志并监控nginx的运行状态。


 688
688


 被折叠的 条评论
为什么被折叠?
被折叠的 条评论
为什么被折叠?
 到【灌水乐园】发言


