


Matlab-数字图像处理-基础实验-图片展缩(使用最近邻、双线性插值)
Problem Statement
1.使用MATLAB开发环境来实现缩放转换。 开发一个函数,可以实现通过最近邻插值的图像缩放:
out = nearest(img, a)
其中img是图片字符串,a是比例因子,a<1或者a>1。
2.开发一个函数,可以实现通过双线性插值的图像缩放:
out = bi_linear(img, a)
其中img是图片字符串,a是比例因子,a<1或者a>1。
Procedure
(A)out = nearest(img, a)
(1) Read image to “img_original” and get image size [row,col].
(2) Initialize the rows and columns of the new image.
(3) Use class()function to obtain the data type of the original image ( “img_original”), so that the new image (out) data type is consistent with the original image.
(4) Traverse the new image (out) and assign to it by calculating the (x,y) of the original image.
(5) Show the results.
(B)out = bi_linear(img, a)
(1) Read image to “img_original” and get image size [row,col].
(2) Initialize the rows and columns of the new image.
(3) Use class()function to obtain the data type of the original image ( “img_original”), so that the new image (out) data type is consistent with the original image.
(4)Loop through the image:
(5) x = i/a; y = j/a;
(6) Calculate x1 and y1
(7) Set the image boundary
(8) Define 4 pixel points P1, P2, P3 and P4, and then assign values to the image through Formula 6 or Formular 3,4,5
Formula 6:
f(x, y) = [ f(1, 0) – f(0, 0)] x + [ f(0, 1) – f(0, 0)]y+ [f(1, 1) – f(0, 1) - f(1, 0) + f(0, 0)]xy+f(0, 0).
Formular 3,4,5:
f(x, 0) = f(0, 0) + x [ f(1, 0) – f(0, 0)]
f(x, 1) = f(0, 1) + x [ f(1, 1) – f(0, 1)]
f(x, y) = f(x, 0) + y [ f(x, 1) – f(x, 0)].
(9)End Loop.
(10)Display image.
Source code
(A)out = nearest(img, a)
function [out] = nearest(img, a)
img_original=imread(img);%500*500
img_original=rgb2gray(img_original);
[row,col] = size(img_original);

%round()舍入到最接近的整数
row = round(row*a);     % 新图像行
col = round(col*a);     % 新图像列
%250*250 *0.5

% 使用class获得原图像的数据类型,使得新图像数据类型与原图像保持一致
out = zeros(row,col,class(img_original));
%250*250

for i=1:row
    for j=1:col
            x = round(i/a);
            y = round(j/a);
            % 为了避免x和y等于0而报错,采取+1处理即可
            if x < 1
                x = 1;
            end
            if y < 1
                y = 1;
            end
            out(i,j) = img_original(x,y);
    end
end

% 显示原图像
figure;
imshow(img);
title("Original Image");

% 显示新图像
out = im2uint8(mat2gray(out));
figure;
imshow(out);
title("New Image");
(B)out = bi_linear(img, a)
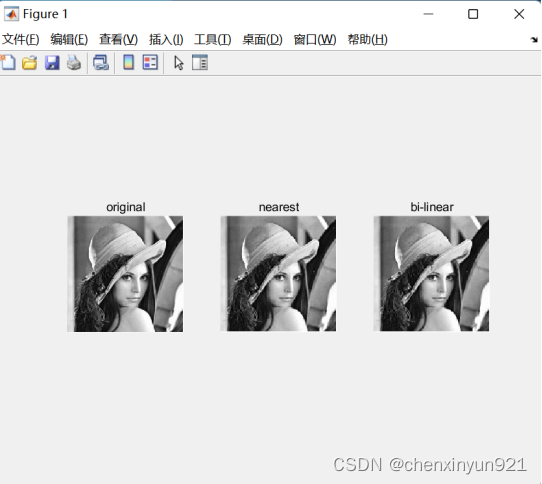
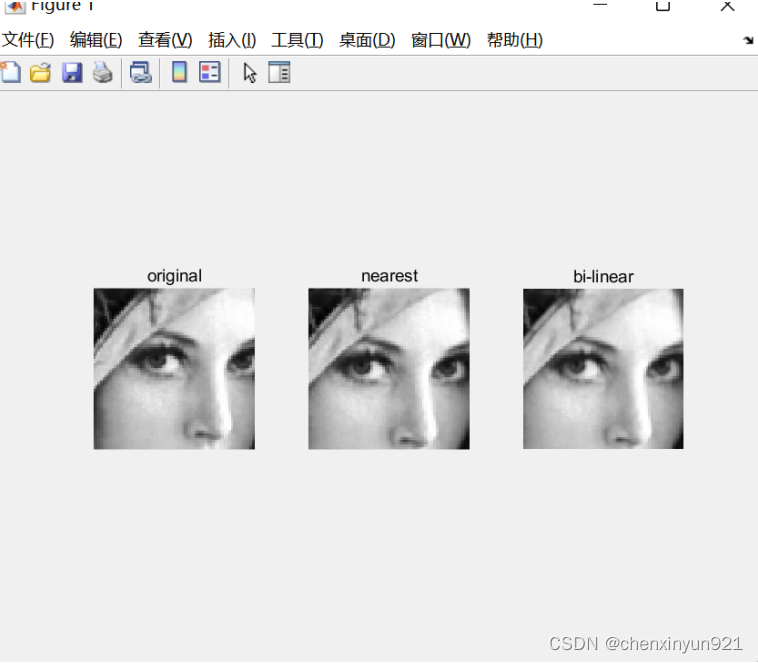
img1=imread("F:\cxy_m\1.png");
img2=nearest("F:\cxy_m\1.png",0.5);
img3=bi_linear1("F:\cxy_m\1.png",0.5);
subplot(1,3,1),imshow(img1),title("original");
subplot(1,3,2),imshow(img2),title("nearest");
subplot(1,3,3),imshow(img3),title("bi-linear");

function [out] = bi_linear1(img,a)
img_original=imread(img);%500*500
%将彩色图像装为灰度图像
img_original=rgb2gray(img_original);
[row,col] = size(img_original);
new_row = round(row*a);
new_col = round(col*a);
%初始化
out = zeros(new_row,new_col,class(img_original));
%遍历
for i = 1:new_row
    for j = 1:new_col
        x = i / a;
        y = j / a;
        x1 = x - floor(x);
        y1 = y - floor(y);
        %边界设置
        if x < 1
           x = 1;
        end
        if y < 1
           y = 1;
        end

        if x > row
            x = row;
        end
        if y > col
            y = col;
        end

        p1 = img_original(floor(x), floor(y));%(0,0)
        p2 = img_original(floor(x), ceil(y));%(0,1)
        p3 = img_original(ceil(x), floor(y));%(1,0)
        p4 = img_original(ceil(x), ceil(y));%(1,1)

%         %PPT8 P17 公式6
%         out(i, j) =	(p3 - p1)* x1  + (p2 - p1)*y1+...
% 			+ (p4 - p2 - p3+ p1)*x1*y1+...
% 			+ p1;
        f1 = p1 + x1*(p3 - p1);%公式三
        f2 = p2 + x1*(p4 - p2);%公式四
        out(i,j) = f1 + y1 * (f2 - f1);%公式五
    end
end
out = im2uint8(mat2gray(out));
figure;
imshow(out);
title('Bilinear interpolation');
end
sample program output
Problems you encountered
(i)It should output one image, but it output three images at once.
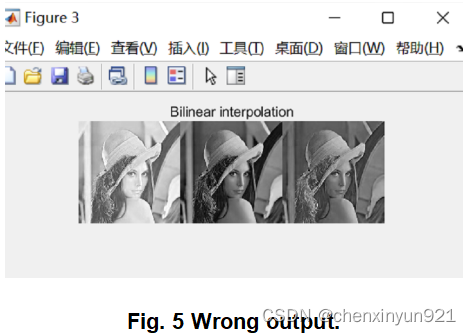
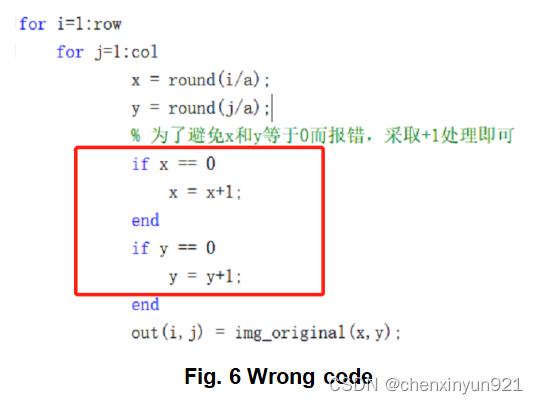
The code here conflicts with the floor() function.I changed it to:x<1,y<1 to solve it.
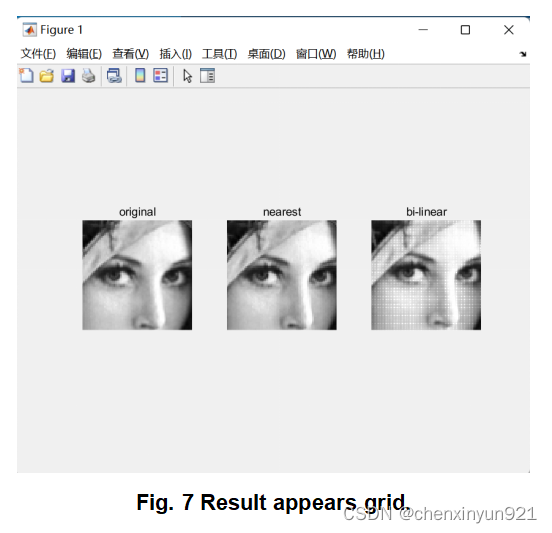
(ii)使用公式3,4,5会出现网格(在现等一位大佬解惑)


 7155
7155


 被折叠的 条评论
为什么被折叠?
被折叠的 条评论
为什么被折叠?
 到【灌水乐园】发言


