


echarts-geo-json-master
or: geometryCouties
规律:市——xxxx00;区——xxxxyy;
| pip search geohash Geohash (1.0) - Module to decode/encode Geohashes to/from latitude and longitude. See http://en.wikipedia.org/wiki/Geohash INSTALLED: 1.0 (latest) python-geohash (0.8.5) - Fast, accurate python geohashing library INSTALLED: 0.8.5 (latest) geohash-hilbert (1.3.1) - Geohash a lng/lat coordinate using the hilbert curve. py-geohash-any (1.1) - Python geohash library designed to use any encoding django-geohash-cluster (0.1.0) - High efficient clustering algorithm based on geohash of points geohash-polygon (0.1) - mzgeohash (1.0.0) - Mapzen Geohash proximityhash (1.0.1) - Geohashes in proximity django-geosimple (1.0.3) - Simple Geohashing helpers pipegeohash (1.3) - A tablular geohashing library geohasher (0.1dev) - Geohash without the iteration geohash2 (1.1) - (Geohash fixed for python3) Module to decode/encode Geohashes to/from latitude and longitude. See http://en.wikipedia.org/wiki/Geohash pygeohash (1.2.0) - Python module for interacting with geohashes libgeohash (0.1.1) - Python library for interacting with geohashes. georaptor (2.0.3) - A Python Geohash Compression Tool geohash_logic (1.0) - From hkwi's geohash module, geohash abstractions that can be used for creating indexs, etc. polygeohash (0.2) - Transform a geoJSON into a list of geohashes that intersect with it geohashcx (0.1.3) - Encode/decode Geohashes http://geohash.org geoh (0.1) - Transform a geoJSON into a list of geohashes that intersect with it geolib (1.0.7) - A library for geohash encoding, decoding and associated functions mz2geohash (1.1.0) - Mapzen Geohash Fork. The original is long unmaintained. django-geohashing (0.2.1) - Django app for working with XKCD geohashing data python-polyhash (0.4.0) - Python library for converting polygons to geohashes and vice versa. polygon-geohasher (0.0.1) - Wrapper over Shapely that returns the set of geohashes that form a Polygon INSTALLED: 0.0.1 (latest) maptiler (1.0.3) - Allows custom geohash bucket sizes and finding buckets in vicinity of given location django-geofield (0.0.2) - A lightweight Django Geo Field to save and handle Geo Points. It supports to search the nearby points by their geohash localhost:python3.6 didi$ | |
调包:Geohash folium
http://incredible.ai/code-snippet/2019/03/16/GeoHash-And-GeoPandas/
https://alysivji.github.io/getting-started-with-folium.html
https://github.com/mrdmnd/geohash-choropleth/blob/master/geohash_choropleth.py
手撸:
https://blog.csdn.net/weixin_43845795/article/details/98473876
geopandas:https://www.jianshu.com/p/dc552bf071af
geopandas结合了pandas和shapely的功能,扩展了pandas在空间数据操作方面的能力,从而使得你可以轻松的用python实现空间数据分析。
import json

'''
dumps():将字典转换为JSON格式的字符串
loads():将JSON格式的字符串转化为字典
dump() :将字典转换为JSON格式的字符串,并将转化后的结果写入文件
load() :从文件读取JSON格式的字符串,并将其转化为字典

'''

d1 = {'父亲':'张三','母亲':'李四', '子女':{'老大':'张五', '老二':'张六'}}

print("\n字典:\n")
print(d1)

#将字典转换为JSON格式的字符串
j1 = json.dumps(d1, ensure_ascii = False, indent = 2)
print("\n将字典转换为JSON格式的字符串:\n")
print(j1)

#将JSON格式的字符串转换为字典
d2 = json.loads(j1)
print("\n将JSON格式的字符串转换为字典:\n")
print(d2)

#将字典内容保存为JSON格式的文件
filename = 'test1.json'
with open(filename, 'w', encoding = 'UTF-8') as f:
    json.dump(d1, f, ensure_ascii = False, indent = 2)

#读取JSON格式文件的内容并转换为字典
with open(filename, 'r', encoding = 'UTF-8') as f:
    d3 = json.load(f)
print("\n读取JSON格式文件的内容并转换为字典:\n")
print(d3)
python将字典转换成dataframe数据框
需要将字典转换成dataframe来操作,并且将字典的key,value分别作为dataframe两列。
数据样例如下:
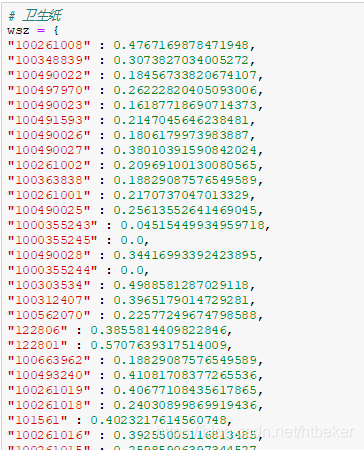
一个key只有一个value的字典如果直接转化成数据框会报错:
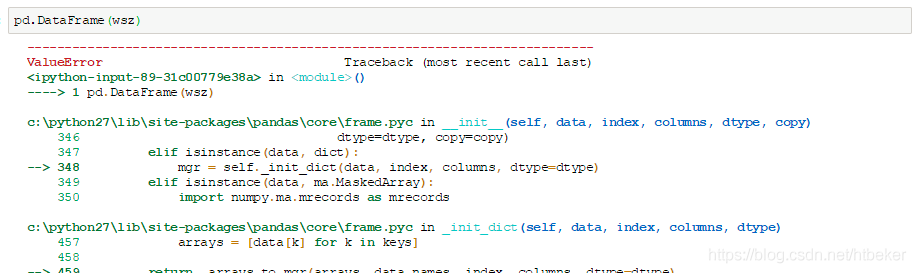
如下两种方法可达成目标。
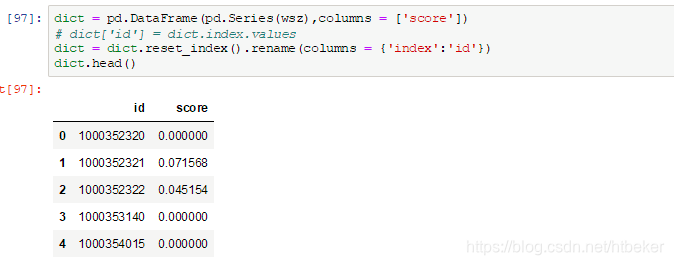
一,将字典转换成Series,将Series转换成dataframe,并将dataframe的索引设为id列。
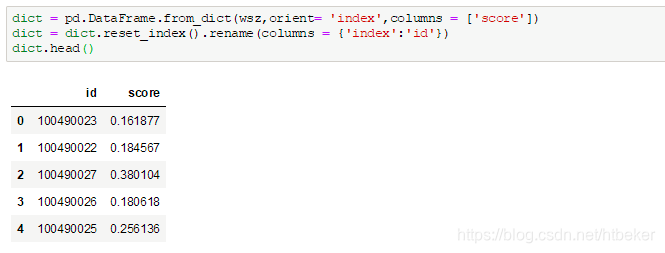
二,使用pd.DataFrame.from_dict方法。
import folium
import json
import pandas as pd
import vincent

county_data = r'us_county_data.csv'
county_geo = r'us-counties.json'

#We want to map the county codes we have in our geometry to those in the
#county_data file, which contains additional rows we don't need
with open(county_geo, 'r') as f:
    get_id = json.load(f)

county_codes = [x['id'] for x in get_id['features']]
county_df = pd.DataFrame({'FIPS_Code': county_codes}, dtype=str)

#Read into Dataframe, cast to string for consistency
df = pd.read_csv(county_data, na_values=[' '])
df['FIPS_Code'] = df['FIPS_Code'].astype(str)

#Perform an inner join, pad NA's with data from nearest county
merged = pd.merge(df, county_df, on='FIPS_Code', how='inner')
merged = merged.fillna(method='pad')

map = folium.Map(location=[39.8282, -98.5795], zoom_start=4)
map.geo_json(county_geo, data=merged,
             columns=['FIPS_Code', 'Unemployed_2011'], key_on='feature.id',
             fill_color='YlGnBu', line_opacity=0.3,
             quantize_range=[0, 5000])
map.create_map()


#https://gist.githubusercontent.com/wrobstory/5586482/raw/6031540596a4ff6cbfee13a5fc894588422fd3e6/data.json
#https://gist.githubusercontent.com/wrobstory/5586482/raw/6031540596a4ff6cbfee13a5fc894588422fd3e6/us-counties.json
将字典写入json文件
data_dict = {'150245': {'name': '存在', 'class': '1', 'cvedate': '2013-01-17', 'type': '202', 'sid': '150245', 'action': '1'}, '150905': {'name': '本地文件', 'class': '1', 'cvedate': '', 'type': '901', 'sid': '150905', 'action': '1', }}
json_str = json.dumps(data_dict, ensure_ascii=False, indent=4) #ensure_ascii=False(输出中文), indent=4(缩进为4)
with open('new_pvs_library4.json', 'w', encoding='utf-8') as f:
f.write(json_str)
#结果:
{
"150245": {
"name": "存在",
"class": "1",
"cvedate": "2013-01-17",
"type": "202",
"sid": "150245",
"action": "1"
},
"150905": {
"name": "本地文件",
"class": "1",
"cvedate": "",
"type": "901",
"sid": "150905",
"action": "1"
}
}Python可视化笔记之folium交互地图
leftlet给R语言提供了很好用的交互式动态地图接口,其在Python中得API接口包名为folium(不知道包作者为何这样起名字,和leaflet已经扯不上关系了),可以满足我们平时常用的热力图、填充地图、路径图、散点标记等高频可视化场景。
本篇主要介绍其在point、line、polygon这三个地理信息场景下得应用:
import pandas as pd
import numpy as np
import os
import folium
from folium import plugins
import webbrowser
import geopandas as gp
Point:
full = pd.read_excel("D:/Python/File/Cities2015.xlsx")
full = full.dropna()
默认情况下folium.Marker函数用于在空间范围内标记点,点得样式是雨滴形状,但是也可以使用folium.RegularPolygonMarker函数来自定义点样式:
schools_map = folium.Map(location=[full['lat'].mean(), full['lon'].mean()], zoom_start=10)
marker_cluster = plugins.MarkerCluster().add_to(schools_map)for name,row in full.iterrows():
     folium.Marker([row["lat"], row["lon"]], popup="{0}:{1}".format(row["cities"], row["GDP"])).add_to(marker_cluster)
#folium.RegularPolygonMarker([row["lat"], row["lon"]], popup="{0}:{1}".format(row["cities"], row["GDP"]),number_of_sides=10,radius=5).add_to(marker_cluster)

display(schools_map)
#schools_map.save('schools_map.html')
#webbrowser.open('schools_map.html')
display用于在编辑器内展示交互地图,save方法可以将交互地图以html文件得形式保存至本地磁盘,webbrowser.open方法可以调用默认浏览器打开本地html格式的交互地图。
polygon:
因为leaflet使用的在线地图并不开放地址匹配功能,也就意味着我们无法通过直接输入行政区名称来获取行政区划边界,所以在制作填充地图时,仍然需要我们构建本地素材。
mydata   = pd.read_csv("D:/R/rstudy/Province/geshengzhibiao.csv", encoding = 'gb18030')
china_map = gp.GeoDataFrame.from_file("D:/R/rstudy/CHN_adm/bou2_4p.shp", encoding = 'gb18030')
#china_map = gp.GeoDataFrame.from_file("D:/R/mapdata/State/china.geojson", encoding = 'gb18030')

China_map = folium.Map(location=[35,120], zoom_start=4)
China_map.choropleth(
 geo_data=open('D:/R/mapdata/State/china.geojson',encoding = 'utf-8').read(),
 data=mydata,
 columns=['province', 'zhibiao'],
 key_on= 'feature.properties.name',
 fill_color='YlGn',
 fill_opacity=0.7,
 line_opacity=0.2)
display(China_map)
China_map.save("China_map.html")
好在folium的choropleth函数直接支持json格式地图,仅需提供素材地址即可,data中应该包含与json素材中的属性表和地理信息边界保持一致得映射表,columns用于指定要用到的字段名称。key_on用于指定json地图数据中和你指定得data中对应得连接键(相当于主键)。
fill_color可以指定用于配色的colorBrewer调色板。
polyline
folium中得线图制作也较为简单,仅需提供给folium.PolyLine函数一组带有嵌套列表或者元组得经纬度点即可。
mydata1 =full.sample(20).loc[:,["lat","lon"]].values.tolist()
mydata2 =[(i,j) for i,j in full.sample(20).loc[:,["lat","lon"]].values.tolist()]
oneUserMap = folium.Map(location=[40.0764,116.2786],zoom_start=4)
folium.PolyLine(mydata1,color = 'black').add_to(oneUserMap)
display(oneUserMap)
oneUserMap = folium.Map(location=[40.0764,116.2786],zoom_start=4)
folium.PolyLine(mydata2,color = 'black').add_to(oneUserMap)
display(oneUserMap)
稍微增加一些循环条件就可以构造出来实用的路径图场景:
def map_fun():
    myresult = full.loc[:,["lat","lon","cities","pop"]].values
    oneUserMap = folium.Map(location=[40.0764,116.2786],zoom_start=4)
    for e in myresult:
        folium.RegularPolygonMarker(
        [e[0],e[1]],
        popup=str(e[2])+":"+str(e[3]),
        fill_color='#769d96',
        number_of_sides=10,
        radius=10
        ).add_to(oneUserMap)
    others    = full.loc[full['cities']!='郑州市',["lat","lon"]].values.tolist()
    for i in range(len(others)):
        zhengzhou = full.loc[full['cities']=='郑州市',["lat","lon"]].values.tolist()
        zhengzhou.append(others[i])
        folium.PolyLine(
            locations = zhengzhou,
            color = 'black'
        ).add_to(oneUserMap)
    display(oneUserMap)
    return Noneif __name__ == '__main__':
    map_fun()
原文发布时间为:2018-07-07
从pandas到geopandas
(欢迎转载,需要保留文末的个人微信公众号二维码)
pandas简介
Pandas是Python的一个结构化数据分析的利器。其中,DataFrame是比较常用的处理数据的对象,类似于一个数据库里的table或者excel中的worksheet,可以非常方便的对二维数据读取(xls,csv,hdf等)、增删改查、基本绘图等。pandas应该是用python做数据分析必不可少的工具。
看一个dataframe的实例
geopandas简介
DataFrame相当于GIS数据中的一张属性表,为了将pandas的特性用到空间数据,就有了geopandas。其目标是使得在python中操作地理数据更方便。
Pandas is an open source project to make working with geospatial data in python easier. GeoPandas extends the datatypes used by pandas to allow spatial operations on geometric types. Geometric operations are performed by shapely. Geopandas further depends on fiona for file access and descartes and matplotlib for plotting.
geopandas结合了pandas和shapely的功能,扩展了pandas在空间数据操作方面的能力,从而使得你可以轻松的用python实现空间数据分析。
看一个geodataframe的实例
与dataframe相对,直观的区别是多了一个geometry的字段。
安装
pip install geopandas
# or
conda install -c conda-forge geopandas
官网示例
先直接照搬一个官网上的例子
p1 = Polygon([(0, 0), (1, 0), (1, 1)])
p2 = Polygon([(0, 0), (1, 0), (1, 1), (0, 1)])
p3 = Polygon([(2, 0), (3, 0), (3, 1), (2, 1)])
g = gpd.GeoSeries([p1, p2, p3])
g.plot()
可以非常方便的计算面积和缓冲区
print g.area
g.buffer(0.5).plot()
还有其他空间数据分析的功能,有兴趣可以去官网了解下。
示例2. 构建geodataframe对象
gepandas提供了多个读取矢量空间数据的接口,支持包括shapefile,geojson等。也支持直接从已有的dataframe对象生成geodataframe,示例如下:
df = pd.DataFrame(np.random.randn(50, 3),columns=['X', 'Y', 'Z'])
geom = [shapely.geometry.Point(xy) for xy in zip(df.X, df.Y)]
gdf = geopandas.GeoDataFrame(df, geometry=geom)
print type(gdf)
输出为
<class 'geopandas.geodataframe.GeoDataFrame'>
示例3. osm路网
下面这个例子,首先获取一个城市(如青岛)的空间范围,根据这个范围下载openstreetmap的道路数据存入geodataframe对象,然后绘制出来。
1. 获取空间范围
这里用之前提到的geocoder这个工具,网友也提到这些地理编码获取的坐标并不准确,我们暂且先不考虑精度的问题。
import geocoder
from shapely.geometry import Polygon

g = geocoder.arcgis(u"青岛")
min_lat = g.bbox.get('southwest')[0]
min_lon = g.bbox.get('southwest')[1]
max_lat = g.bbox.get('northeast')[0]
max_lon = g.bbox.get('northeast')[1]

boundary = Polygon([(min_lon, min_lat),(min_lon,max_lat),(max_lon,max_lat), (max_lon, min_lat)])
这样获取到的青岛市的空间范围(外接矩形)为
{'northeast': [36.209606, 120.482939], 'southwest': [35.987606, 120.260939]}
2. 下载osm数据
这里用到geopandas_osm这个工具,安装命令为
pip install git+https://github.com/jwass/geopandas_osm.git
将空间范围的polygon对象作为参数即可,可以查看一下对象类型和投影参数:
import geopandas_osm.osm
df = geopandas_osm.osm.query_osm('way', boundary, recurse='down', tags='highway')

print type(df)
print df.crs
输出为
<class 'geopandas.geodataframe.GeoDataFrame'>
{'init': 'epsg:4326', 'no_defs': True}
直接获取到的osm数据比较乱,做进一步筛选:
way = df[df.type == 'LineString'][['highway', 'name', 'geometry']]
way.head()
可以计算道路的长度,这里只是示意。直接计算length并不对,应该先投影到平面坐标系。
df.ix[0].geometry.length
输出为
0.0014679943869086182
3. 绘制路网
可以直接用plot命令,绘制出来:
way.plot(column="name",colormap=cm.coolwarm_r)
代码下载
如果对本文中的代码(.ipynb文件)感兴趣,百度网盘链接:http://pan.baidu.com/s/1mh8FghE, 密码请在关注个人微信公众号stdrei后,输入口令‘pandas2geo’自动获取。
Convert a pandas DataFrame to a GeoDataFrame
Convert the DataFrame's content (e.g. Lat and Lon columns) into appropriate Shapely geometries first and then use them together with the original DataFrame to create a GeoDataFrame.
from geopandas import GeoDataFrame
from shapely.geometry import Point

geometry = [Point(xy) for xy in zip(df.Lon, df.Lat)]
df = df.drop(['Lon', 'Lat'], axis=1)
crs = {'init': 'epsg:4326'}
gdf = GeoDataFrame(df, crs=crs, geometry=geometry)
Result:
    Date/Time           ID      geometry
0   4/1/2014 0:11:00    140     POINT (-73.95489999999999 40.769)
1   4/1/2014 0:17:00    NaN     POINT (-74.03449999999999 40.7267)
Since the geometries often come in the WKT format, I thought I'd include an example for that case as well:
import geopandas as gpd
import shapely.wkt

geometry = df['wktcolumn'].map(shapely.wkt.loads)
df = df.drop('wktcolumn', axis=1)
crs = {'init': 'epsg:4326'}
gdf = gpd.GeoDataFrame(df, crs=crs, geometry=geometry)
Given a pandas.DataFrame that has x Longitude and y Latitude like so:
df.head()
x   y
0   229.617902  -73.133816
1   229.611157  -73.141299
2   229.609825  -73.142795
3   229.607159  -73.145782
4   229.605825  -73.147274
Let's convert the pandas.DataFrame into a geopandas.GeoDataFrame as follows:
Library imports and shapely speedups:
import geopandas as gpd
import shapely
shapely.speedups.enable()
Code + benchmark times on a test dataset I have lying around:
#Martin's original version:
#%timeit 1.87 s ± 7.03 ms per loop (mean ± std. dev. of 7 runs, 1 loop each)
gdf = gpd.GeoDataFrame(df.drop(['x', 'y'], axis=1),
                                crs={'init': 'epsg:4326'},
                                geometry=[shapely.geometry.Point(xy) for xy in zip(df.x, df.y)])


#Pandas apply method
#%timeit 8.59 s ± 60.6 ms per loop (mean ± std. dev. of 7 runs, 1 loop each)
gdf = gpd.GeoDataFrame(df.drop(['x', 'y'], axis=1),
                       crs={'init': 'epsg:4326'},
                       geometry=df.apply(lambda row: shapely.geometry.Point((row.x, row.y)), axis=1))
Using pandas.apply is surprisingly slower, but may be a better fit for some other workflows (e.g. on bigger datasets using dask library):
Credits to:
- Making shapefile from Pandas dataframe? (for the pandas apply method)
- Speed up row-wise point in polygon with Geopandas (for the speedup hint)
Some Work-In-Progress references (as of 2017) for handling big dask datasets:
- http://matthewrocklin.com/blog/work/2017/09/21/accelerating-geopandas-1
- https://github.com/geopandas/geopandas/issues/461
- https://github.com/mrocklin/dask-geopandas
果然快到飞起了:
| Linux下,修改 ~/.pip/pip.conf (没有就创建一个文件夹及文件。文件夹要加“.”,表示是隐藏文件夹) [global]
| |
| conda导出已有环境: 环境会被保存在 environment.yaml文件中。当我们想再次创建该环境,或根据别人提供的.yaml文件复现环境时,可以: conda env create -f environment.yaml 就可以复现安装环境。移植过来的环境只是安装了你原来环境里用conda install等命令直接安装的包,你用pip之类装的东西没有移植过来,需要你重新安装。
pip导出安装的库到requirements.txt pip freeze > requirements.txt pip导入requirements.txt中列出的库到系统 pip install -r requirements.txt
| |
| How do I add python3 kernel to jupyter in Mac 情况:Mac我已经安装了python3.6,也已经安装了jupyter notebook,Mac自带的有python2.7, 不知道不用第一步用pip3在安装一次jupyter notebook可不可以,米有去试,因为已经按这个搞好了。。 参考地址: How to add python2 kernel to jupyter in Windows python2 -m pip install ipykernel | |
| conda nb 和 命令行,包( folium)版本不一样的问题
| |
| which conda或conda –version python –version或python -V conda list 查看安装了哪些包。 conda env list 或 conda info -e 查看当前存在哪些虚拟环境 conda update conda 检查更新当前conda 创建新的环境 | |
https://www.jianshu.com/p/dc552bf071af
geopandas
geo_mean 多经纬度中心计算方法:
1) 地理中心点
地理中心点的求解过程非常的简单,即将每个经纬度转化成x,y,z的坐标值。然后根据根据x,y,z的值,寻找3D坐标系中的中心点。
2)平均经纬度
所谓的平均经纬度是将经纬度坐标看成是平面坐标,直接计算经度和纬度的平均值。注意:该方法只是大致的估算方法,仅适合距离在400KM以内的点。
3)最小距离点
所谓的最小距离点,表示的是如何给出的点中哪一点到各个点的距离最近,常用于路径相关的场景。比较简单的实现方式是使用K-Means,并将K值设为1。注意,Scikit Learn中自带的Kmeans默认是欧式距离,不支持自定义。解决方法是自己实现:


 9334
9334


 被折叠的 条评论
为什么被折叠?
被折叠的 条评论
为什么被折叠?
 到【灌水乐园】发言


