


Unsupervised learning - introduction
- Talk about clustering
- Learning from unlabeled data
- Unsupervised learning
-
- Useful to contras with supervised learning
- Compare and contrast
- Supervised learning
- Given a set of labels, fit a hypothesis to it
- Unsupervised learning
- Try and determining structure in the data
- Clustering algorithm groups data together based on data features
- Supervised learning
- What is clustering good for
-
- Market segmentation - group customers into different market segments
- Social network analysis - Facebook "smartlists"
- Organizing computer clusters and data centers for network layout and location
- Astronomical data analysis - Understanding galaxy formation
K-means algorithm
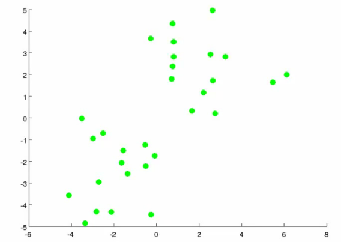
- Want an algorithm to automatically group the data into coherent clusters
- K-means is by far the most widely used clustering algorithm
- Take unlabeled data and group into two clusters
- Algorithm overview
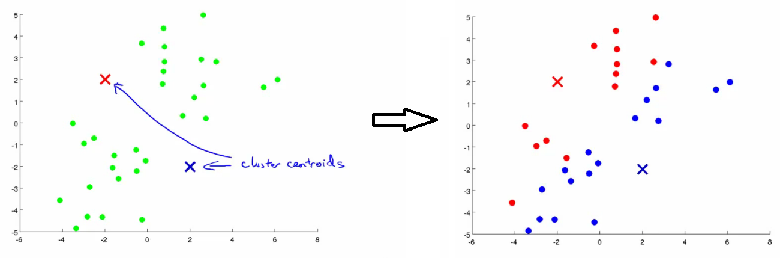
- 1) Randomly allocate two points as the cluster centroids
- Have as many cluster centroids as clusters you want to do (K cluster centroids, in fact)
- In our example we just have two clusters
- 2) Cluster assignment step
- Go through each example and depending on if it's closer to the red or blue centroid assign each point to one of the two clusters
- To demonstrate this, we've gone through the data and "colour" each point red or blue
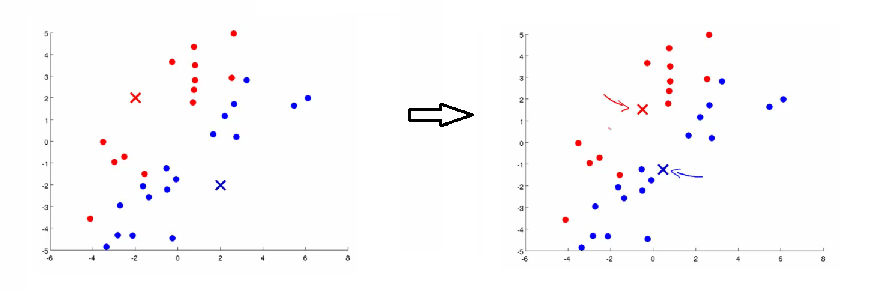
- 3) Move centroid step
- Take each centroid and move to the average of the correspondingly assigned data-points
- Repeat 2) and 3) until convergence
- Take each centroid and move to the average of the correspondingly assigned data-points
- 1) Randomly allocate two points as the cluster centroids
- More formal definition
- Input:
- K (number of clusters in the data)
- Training set {x1, x2, x3 ..., xn)
- Algorithm:
- Randomly initialize K cluster centroids as {μ1, μ2, μ3 ... μK}
-
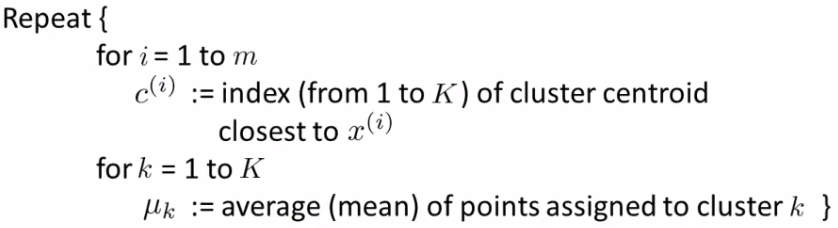
- Loop 1
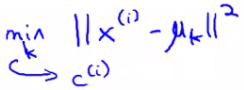
- This inner loop repeatedly sets the c(i) variable to be the index of the closes variable of cluster centroid closes to xi
- i.e. take ith example, measure squared distance to each cluster centroid, assign c(i)to the cluster closest
- Loop 2
-
- Loops over each centroid calculate the average mean based on all the points associated with each centroid from c(i)
- Loop 1
-
- What if there's a centroid with no data
-
- Remove that centroid, so end up with K-1 classes
- Or, randomly reinitialize it
-
- Not sure when though...
- Randomly initialize K cluster centroids as {μ1, μ2, μ3 ... μK}
- Input:
- So far looking at K-means where we have well defined clusters
- But often K-means is applied to datasets where there aren't well defined clusters
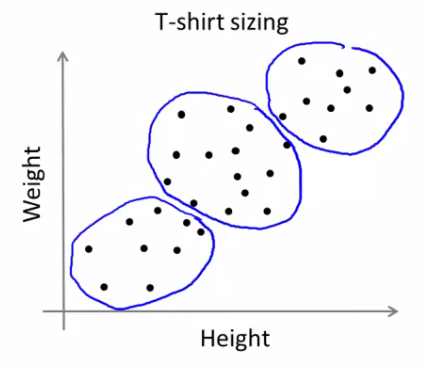
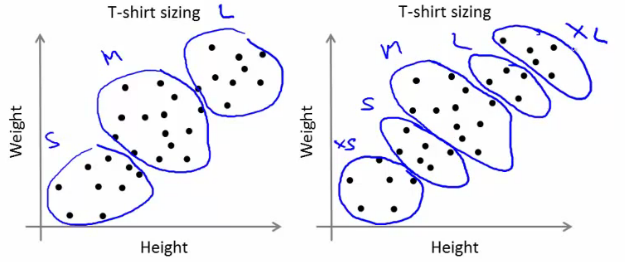
- e.g. T-shirt sizing
- e.g. T-shirt sizing
- Not obvious discrete groups
- Say you want to have three sizes (S,M,L) how big do you make these?
- One way would be to run K-means on this data
- May do the following
- So creates three clusters, even though they aren't really there
- Look at first population of people
- Try and design a small T-shirt which fits the 1st population
- And so on for the other two
- This is an example of market segmentation
-
- Build products which suit the needs of your subpopulations

K means optimization objective
- Supervised learning algorithms have an optimization objective (cost function)
- K-means does too
- K-means has an optimization objective like the supervised learning functions we've seen
- Why is this good?
-
- Knowing this is useful because it helps for debugging
- Helps find better clusters
- While K-means is running we keep track of two sets of variables
- ci is the index of clusters {1,2, ..., K} to which xi is currently assigned
- i.e. there are m ci values, as each example has a ci value, and that value is one the the clusters (i.e. can only be one of K different values)
- μk, is the cluster associated with centroid k
- Locations of cluster centroid k
- So there are K
- So these the centroids which exist in the training data space
- μci, is the cluster centroid of the cluster to which example xi has been assigned to
- This is more for convenience than anything else
- You could look up that example i is indexed to cluster j (using the c vector), where j is between 1 and K
- Then look up the value associated with cluster j in the μ vector (i.e. what are the features associated with μj)
- But instead, for easy description, we have this variable which gets exactly the same value
- Lets say xi as been assigned to cluster 5
- Means that
- ci = 5
- μci, = μ5
- Means that
- This is more for convenience than anything else
- ci is the index of clusters {1,2, ..., K} to which xi is currently assigned
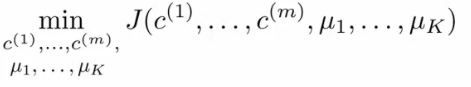
- Using this notation we can write the optimization objective;
- i.e. squared distances between training example xi and the cluster centroid to which xi has been assigned to
- This is just what we've been doing, as the visual description below shows;
- The red line here shows the distances between the example xi and the cluster to which that example has been assigned
- Means that when the example is very close to the cluster, this value is small
- When the cluster is very far away from the example, the value is large
- This is just what we've been doing, as the visual description below shows;
- This is sometimes called the distortion (or distortion cost function)
- So we are finding the values which minimizes this function;
- i.e. squared distances between training example xi and the cluster centroid to which xi has been assigned to
- If we consider the k-means algorithm
- The cluster assigned step is minimizing J(...) with respect to c1, c2 ... ci
- i.e. find the centroid closest to each example
- Doesn't change the centroids themselves
- The move centroid step
- We can show this step is choosing the values of μ which minimizes J(...) with respect to μ
- So, we're partitioning the algorithm into two parts
- First part minimizes the c variables
- Second part minimizes the J variables
- The cluster assigned step is minimizing J(...) with respect to c1, c2 ... ci
- We can use this knowledge to help debug our K-means algorithm


Random initialization
- How we initialize K-means
- And how avoid local optimum
- Consider clustering algorithm
- Never spoke about how we initialize the centroids
- A few ways - one method is most recommended
- Never spoke about how we initialize the centroids
- Have number of centroids set to less than number of examples (K < m) (if K > m we have a problem)0
- Randomly pick K training examples
- Set μ1 up to μK to these example's values
- K means can converge to different solutions depending on the initialization setup
- Risk of local optimum
- The local optimum are valid convergence, but local optimum not global ones
- Risk of local optimum
- If this is a concern
- We can do multiple random initializations
- See if we get the same result - many same results are likely to indicate a global optimum
- We can do multiple random initializations
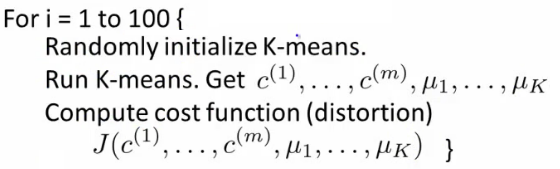
- Algorithmically we can do this as follows;
- A typical number of times to initialize K-means is 50-1000
- Randomly initialize K-means
- For each 100 random initialization run K-means
- Then compute the distortion on the set of cluster assignments and centroids at convergent
- End with 100 ways of cluster the data
- Pick the clustering which gave the lowest distortion
- If you're running K means with 2-10 clusters can help find better global optimum
-
- If K is larger than 10, then multiple random initializations are less likely to be necessary
- First solution is probably good enough (better granularity of clustering)

How do we choose the number of clusters?
- Choosing K?
- Not a great way to do this automatically
- Normally use visualizations to do it manually
- What are the intuitions regarding the data?
- Why is this hard
- Sometimes very ambiguous
- e.g. two clusters or four clusters
- Not necessarily a correct answer
- This is why doing it automatic this is hard
- Sometimes very ambiguous
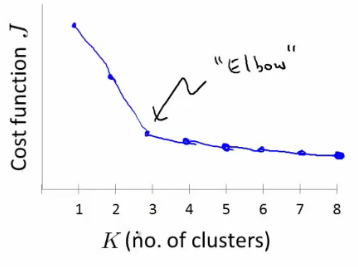
- Vary K and compute cost function at a range of K values
- As K increases J(...) minimum value should decrease (i.e. you decrease the granularity so centroids can better optimize)
- Plot this (K vs J())
- Look for the "elbow" on the graph
- Chose the "elbow" number of clusters
- If you get a nice plot this is a reasonable way of choosing K
- Risks
- Normally you don't get a a nice line -> no clear elbow on curve
- Not really that helpful
- Using K-means for market segmentation
- Running K-means for a later/downstream purpose
- See how well different number of clusters serve you later needs
- e.g.
- T-shirt size example
- If you have three sizes (S,M,L)
- Or five sizes (XS, S, M, L, XL)
- Run K means where K = 3 and K = 5
- How does this look
- This gives a way to chose the number of clusters
- Could consider the cost of making extra sizes vs. how well distributed the products are
- How important are those sizes though? (e.g. more sizes might make the customers happier)
- So applied problem may help guide the number of clusters
- T-shirt size example


 1546
1546

 被折叠的 条评论
为什么被折叠?
被折叠的 条评论
为什么被折叠?
 到【灌水乐园】发言


