


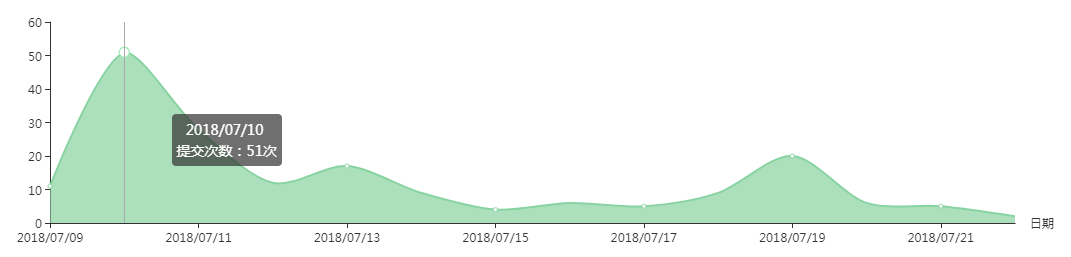
还是先上最终效果图:
代码实现:
<template>
    <div :class="classPrefix">
        <div ref = 'myEchart' :class="classPrefix+'_chart'"></div>
    </div>
</template>

<script type="text/babel">
import echarts from 'echarts'
export default {
    data() {
        return {
            classPrefix: "qst-tecs-src-teacher-dean-areaChart_",
        }
    },
    props: {
        // 横坐标的天数
        xNumber: {
            type: [Number,Array],
            default:[],
        },
        // 纵坐标提交次数
        yNumber: {
            type: [Number,Array],
            default:[],
        },
        //  阴影部分的颜色
        bgColor: {
            type: String,
            default: '',
        }
    },
    methods: {
        // 图表初始化数据
        initChart(){
            let myChart = echarts.init(this.$refs.myEchart);
            let yNumber = this.yNumber;
            myChart.setOption({
                tooltip: {
                    trigger: 'axis',
                    formatter: "{b} </br> 提交次数:{c}次"
                },
                xAxis: {
                    type: 'category',
                    boundaryGap: false,
                    data: this.xNumber,
                    name: '日期',
                },
                yAxis: {
                    type: 'value',
                    splitLine: {
                        show: false
                    }
                },
                series: [{
                    type: 'line',
                    data: yNumber,
                    smooth: true,
                    // 线的颜色
                    lineStyle: {
                        normal: {
                            color: this.bgColor,
                        }
                    },
                    // 线上圆圈的颜色
                    itemStyle: {
                        normal: {
                            color: this.bgColor,
                        }
                    },
                    // 阴影面积的颜色
                    areaStyle: {
                        normal: {
                            color: this.bgColor,
                        }
                    },
                }],
                //边距
                grid: {
                    left: '2%',
                    right: '4%',
                    bottom: '0%',
                    top: '4%',
                    containLabel: true
                },
            })
        },
    },
    mounted () {
        let obj = this.$refs.myEchart;
        if(obj){
            this.initChart();
        }
    }
}
</script>

<style lang="scss" type="text/scss" rel="stylesheet/scss" scoped>
.qst-tecs-src-teacher-dean-areaChart_ {
    &_chart{
        height:240px;
        width:1050px;
        margin: 0 auto;
        padding-top: 10px;
        box-sizing: border-box;
    }
}
</style>
使用示例:
<areaChart v-else :yNumber="devoteY" :xNumber='devoteX' :bgColor="'#f17f49'"></areaChart>


devoteY:[10,52,42,46,12],   // 学生贡献的Y轴数据
devoteX:[‘2018-03-10’,‘2018-05-23’,‘2018-05-29’,‘2018-06-05’,‘2018-06-13’],  // 学生贡献的X轴数据
颜色可根据组件中设置的部分自定义哦


 2699
2699

 被折叠的 条评论
为什么被折叠?
被折叠的 条评论
为什么被折叠?
 到【灌水乐园】发言


