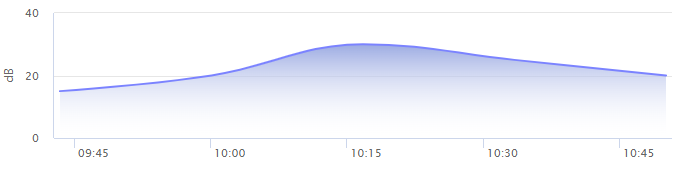
vue+highCharts---曲线面积图实例1

效果图:

在这里插入图片描述

option代码:

option:{
	 	chart: {
          type: 'areaspline',
          marginRight: 10
        },
        plotOptions: {
          series: {
            animation: false, // 去除渲染动画
            turboThreshold: 0, // 不限制点数,
            fillColor: {// 注意!!!如果是柱状图请使用color,如果是面积图请使用fillColor
              linearGradient: {
                x1: 0,
                y1: 0,
                x2: 0,
                y2: 1
              },
              stops: [
                [0, '#9CABE2'],
                [1, HighCharts.Color('white').setOpacity(0).get('rgba')]
              ]
            },
            marker: {
              enabled: false,
              symbol: 'circle',
              radius: 10,
              states: {
                hover: {
                  enabled: true
                }
              }
            }
          }
        },
        colors: ['#7b83ff'],
        time: {
          useUTC: false
        },
        title: {
          text: ''
        },
        credits: {
          enabled: false// 隐藏右下角水印
        },
        accessibility: {
          announceNewData: {
            enabled: true,
            minAnnounceInterval: 15000,
            announcementFormatter: function(allSeries, newSeries, newPoint) {
              if (newPoint) {
                return 'New point added. Value: ' + newPoint.y
              }
              return false
            }
          }
        },
        xAxis: {
          type: 'datetime',
          tickPixelInterval: 150,
          title: {
            text: ''
          }
        },
        yAxis: {
          title: {
            text: 'dB'
          },
          // tickInterval: 10, // 间隔
          // max: 50, // 最大值
          min: 0, // 最小值
          lineWidth: 1
        },
        tooltip: {
          headerFormat: '',
          // pointFormat: '{point.x:%Y-%m-%d %H:%M:%S:%L}<br/>噪声:{point.y:.2f} dB',
          pointFormat: '{point.x:%Y-%m-%d %H:%M:%S}<br/>噪声:{point.y:.2f} dB',
          shared: true,
          crosshairs: [true, false]
        },
        legend: {
          enabled: false // 数据划过时,才显示点标记
        },
        exporting: {
          enabled: false
        },
        series: [{
          name: '噪声',
          data: [{ x: 1637117403000, y: 20 }, { x: 1637116403000, y: 25 }, { x: 1637115403000, y: 30 }, { x: 1637114403000, y: 20 }, { x: 1637113403000, y: 15 }],
          marker: {
            enabled: false
          }
        }]
}
  • 0
    点赞
  • 1
    收藏
    觉得还不错? 一键收藏
  • 0
    评论

“相关推荐”对你有帮助么?

  • 非常没帮助
  • 没帮助
  • 一般
  • 有帮助
  • 非常有帮助
提交
评论
添加红包

请填写红包祝福语或标题

红包个数最小为10个

红包金额最低5元

当前余额3.43前往充值 >
需支付:10.00
成就一亿技术人!
领取后你会自动成为博主和红包主的粉丝 规则
hope_wisdom
发出的红包
实付
使用余额支付
点击重新获取
扫码支付
钱包余额 0

抵扣说明:

1.余额是钱包充值的虚拟货币,按照1:1的比例进行支付金额的抵扣。
2.余额无法直接购买下载,可以购买VIP、付费专栏及课程。

余额充值