


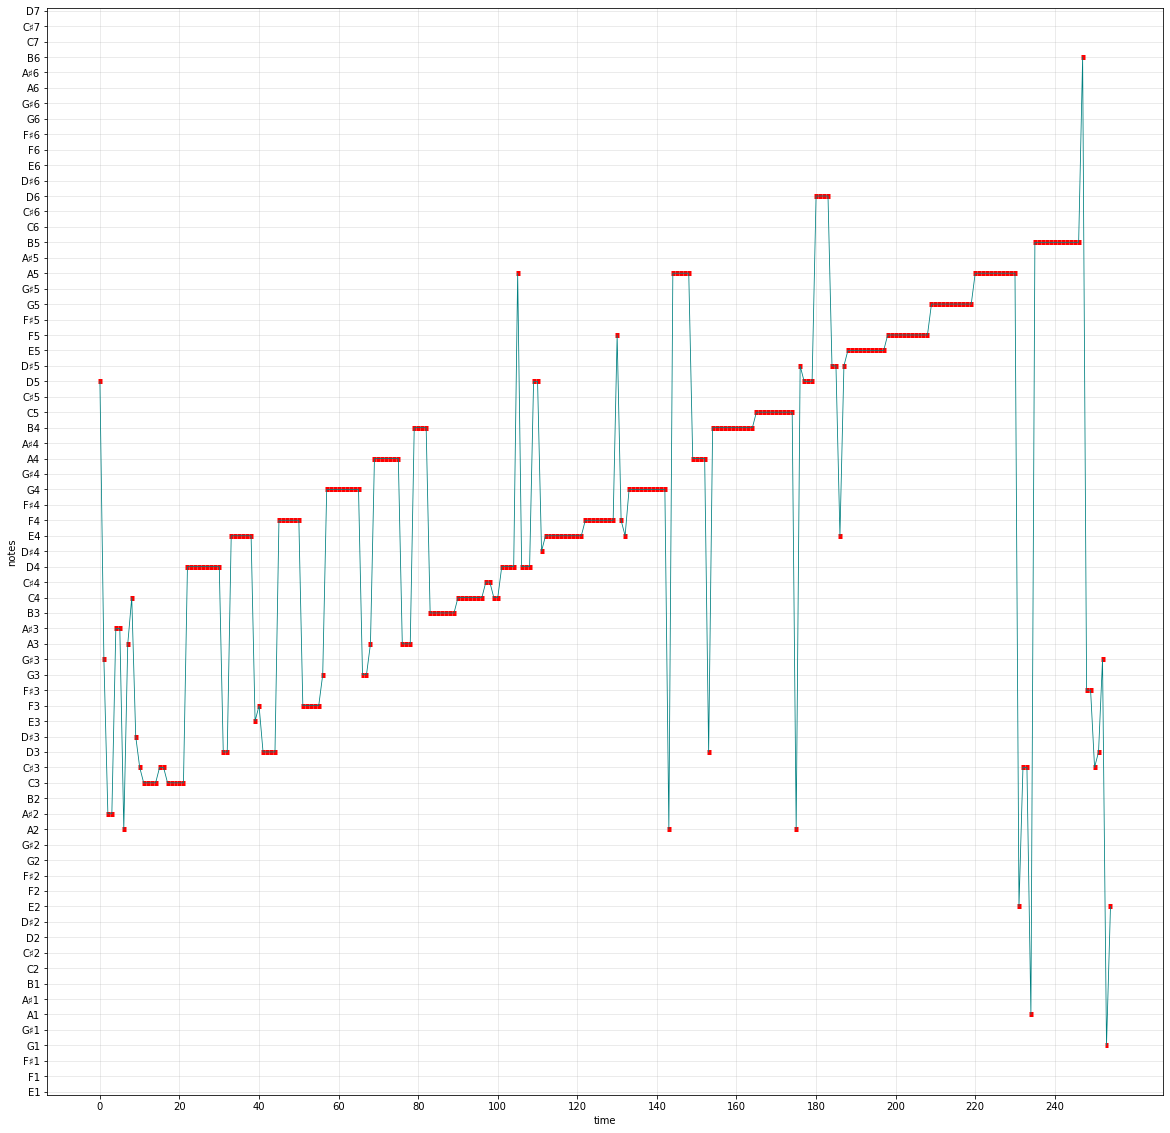
使用librosa展示音乐中多个八度的详细音高时长图谱
示例中使用了7个八度的音高范围以及钢琴中间的3个八度录音
import matplotlib.pyplot as plt
import librosa
import numpy as np
import pandas as pd
# 读取音频文件
audio_file = 'C://Users//roben//Desktop//wavMID/3-8.wav'
y, sr = librosa.load(audio_file)

# 提取音高
pitches, magnitudes = librosa.piptrack(y=y, sr=22050, S=None, n_fft=4096, hop_length=None, fmin=27.5, fmax=4186.0,
                                       threshold=0.9999, win_length=None, window='hann', center=True, pad_mode='constant', ref=None)
print(pitches.shape)
df=pd.DataFrame(pitches)
print(df.shape)
# df=df.drop(df.index[(df == 0).all(axis=1)])
# print(df.shape)

#音高转化为音符
df=df.applymap(lambda x: librosa.hz_to_note(x) if x>0 else 0)
#print(df)
#df.to_excel("C://Users//roben//Desktop//ccc.xlsx", encoding='gbk')

 #生成7个八度的index_list
list0 =["C","C♯","D","D♯","E","F","F♯","G","G♯","A","A♯","B"]
index_list=[]
for i in range(1,8):
    index_list=index_list+[ x+str(i) for x in list0]
print(index_list)

#音符转化为显示序列
df=df.applymap(lambda x: index_list.index(x)+1 if x in index_list else 0)
#print(df)
#df.to_excel("C://Users//roben//Desktop//index.xlsx", encoding='gbk')
#提取音符显示序列
ones= np.ones(df.shape[0])
print(ones.shape)
note_values=ones.dot(df)
print(note_values)

#展示音高与时长图谱
plt.figure(figsize=(20,20))
plt.xlabel('time')
plt.ylabel('notes')
plt.grid(linewidth=0.5,alpha=0.5)
plt.xticks(range(0,df.shape[1],20))
plt.yticks(range(1,len(index_list)+1),index_list)
plt.plot(note_values,color="#008080",linewidth=0.8)
plt.hlines(note_values, np.array(range(len(note_values)))-0.5,np.array(range(len(note_values)))+0.5,color="red", linewidth=5)
plt.show()


 6659
6659

 被折叠的 条评论
为什么被折叠?
被折叠的 条评论
为什么被折叠?
 到【灌水乐园】发言


