


线性回归
线性回归(Linear Regression) 是利用数理统计中回归分析,来确定两种或两种以上变量间相互依赖的定量关系的一种统计分析方法
核心思想
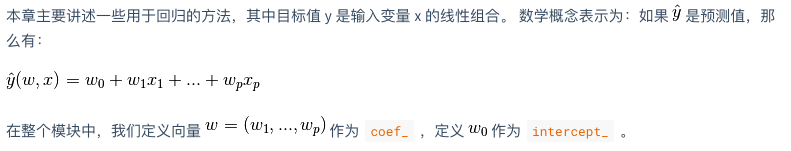
sklearn 文档概述
简单线性回归 (一元线性回归)
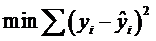
找到一条直线,此直线到每个点的距离之和最小 ==> 最小二乘法(初中所学)
import matplotlib.pyplot as plt
import numpy as np
from sklearn.linear_model import LinearRegression
### 距离km
x = [3.4, 1.8, 4.6, 2.3, 3.1, 5.5, 0.7, 3.0, 2.6, 4.3, 2.1, 1.1, 6.1, 4.8, 3.8]
### 价格
y = [26.2, 17.8, 31.3, 23.1, 27.5, 36.0, 14.1, 22.3, 19.6, 31.3, 24.0, 17.3, 43.2, 36.4, 26.1]
x_in = np.array(x).reshape(-1,1)
y_in = np.array(y).reshape(-1,1)
lreg = LinearRegression()
result = lreg.fit(x_in, y_in)
b1 = result.coef_[0][0]
b0 = result.intercept_[0]
print(b1)
print(b0)
y_prd = lreg.predict(x_in)
# 散点图
plt.scatter(x, y)
plt.plot(x_in,y_prd,'m')
plt.xlabel("km")
plt.ylabel("rmb")
plt.title("price")
plt.show()
多元线性回归
import matplotlib.pyplot as plt
from mpl_toolkits.mplot3d import Axes3D
import numpy as np
from sklearn.linear_model import LinearRegression

x = [[100,4],[50,3],[100,4],[100,2],[50,2],[80,2],[75,3],[65,4],[90,3],[90,2]]
y = [9.3,4.8,8.9,6.5,4.2,6.2,7.4,6.0,7.6,6.1]

x = np.array(x)
y = np.array(y)
lreg = LinearRegression()
result = lreg.fit(x, y)
# 权重值
b1 = result.coef_[0][0]
# 偏置值
b0 = result.intercept_[0]
print(b1)
print(b0)


 3096
3096


 被折叠的 条评论
为什么被折叠?
被折叠的 条评论
为什么被折叠?
 到【灌水乐园】发言


