


devtools使用
This article is part of a series created in partnership with SiteGround. Thank you for supporting the partners who make SitePoint possible.
本文是与SiteGround合作创建的系列文章的一部分。 感谢您支持使SitePoint成为可能的合作伙伴。
CSS animations are known to be super performant. Although this is the case for simple animations on a few elements, if you didn’t code your animations with performance in mind and add more complexity, website users will soon take notice and possibly get annoyed.
CSS动画是众所周知的超级性能。 尽管某些元素上的简单动画就是这种情况,但如果您不考虑性能而编写动画并增加复杂性,网站用户很快就会注意到并可能会感到烦恼。
In this article, I introduce some useful browser DevTools features that will enable you to check what happens under the hood when animating with CSS. This way, when an animation looks a bit choppy, you’ll have a better idea why and what you can do to fix it.
在本文中,我介绍了一些有用的浏览器DevTools功能,这些功能使您可以检查在使用CSS进行动画制作时发生的情况。 这样,当动画看起来有些断断续续时,您将更好地了解为什么以及如何解决该问题。
CSS性能开发工具 (Developer Tools for CSS Performance)
Your animations need to hit 60 fps (frames per second) to run fluidly in the browser. The lower the rate, the worse your animation will look. This means the browser has no more than about 16 milliseconds to do its job for one frame. But what does it do during that time? And how would you know if your browser is keeping up with the desired framerate?
您的动画需要达到60 fps(每秒帧)才能在浏览器中流畅运行。 速率越低,动画效果越差。 这意味着浏览器在一帧内完成工作的时间不超过16毫秒。 但是那段时间呢? 您怎么知道您的浏览器是否跟上了理想的帧率呢?
I think nothing beats user experience when it comes to assessing the quality of an animation. However, developer tools in modern browsers, while not always 100% reliable, have been getting smarter and smarter, and there’s quite a bit you can do to review, edit and debug your code using them.
我认为在评估动画质量时,没有什么能比用户体验更好。 但是,现代浏览器中的开发人员工具虽然并不总是100%可靠,但变得越来越聪明,您可以使用它们来做很多工作来查看,编辑和调试代码。
This is also true when you need to check framerate and CSS animation performance. Here’s how it works.
当您需要检查帧速率和CSS动画性能时,也是如此。 运作方式如下。
在Firefox中探索性能工具 (Exploring the Performance Tool in Firefox)
In this article I use the Firefox Performance tool. The other big contender is the Chrome Performance Tool. You can pick your favorite, as both browsers offer powerful performance features.
在本文中,我使用Firefox性能工具。 另一个竞争者是Chrome Performance Tool。 您可以选择自己喜欢的,因为两种浏览器都提供强大的性能功能。
To open the developer tools in Firefox, choose one of these options:
要在Firefox中打开开发人员工具,请选择以下选项之一:
Right-click on your web page and choose Inspect Element in the context menu
右键单击您的网页,然后在上下文菜单中选择“ 检查元素 ”
If you use the keyboard, press Ctrl + Shift + I on Windows and Linux or Cmd + Opt + I on macOS.
如果使用键盘,请在Windows和Linux上按Ctrl + Shift + I ,在macOS上按Cmd + Opt +I 。
Next, click on the Performance tab. Here, you’ll find the button that lets you start a recording of your website’s performance:
接下来,单击“ 性能”选项卡。 在这里,您会找到用于开始记录网站性能的按钮:
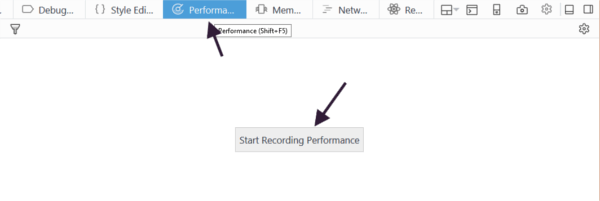
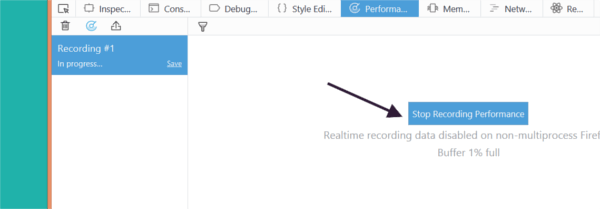
Press that button and wait for a few seconds or perform some action on the page. When you’re done, click the Stop Recording Performance button:
按下该按钮,等待几秒钟或在页面上执行某些操作。 完成后,单击“ 停止录制性能”按钮:
In a split second, Firefox presents you with tons of well-organized data that will help you make sense of which issues your code is suffering from.
瞬间,Firefox为您提供了大量组织良好的数据,可帮助您了解代码所遭受的问题。
The result of a recording inside the Performance panel looks something like this:
“ 性能”面板中的记录结果如下所示:
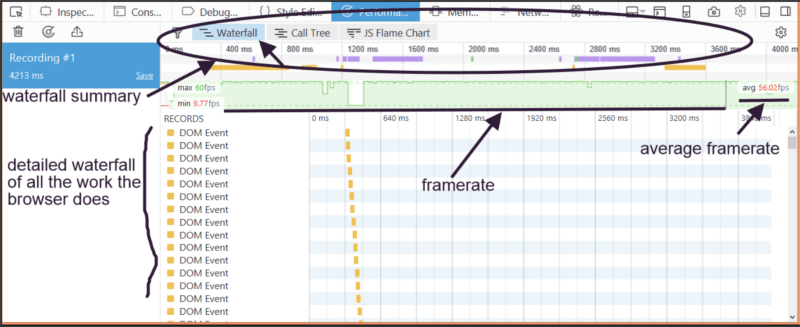
The Waterfall section is perfect for checking issues related to CSS transitions and keyframe animations. Other sections are the Call Tree and the JS Flame Chart, which you can use to find out about bottlenecks in your JavaScript code.
Waterfall部分非常适合检查与CSS过渡和关键帧动画有关的问题。 其他部分是“ 调用树”和“ JS火焰图” ,您可以使用它们来了解JavaScript代码中的瓶颈。
The Waterfall has a summary section at the top and a detailed breakdown. In both, the data is color-coded:
Waterfall在顶部有一个摘要部分,并提供了详细的细分。 在这两种情况下,数据均采用颜色编码:
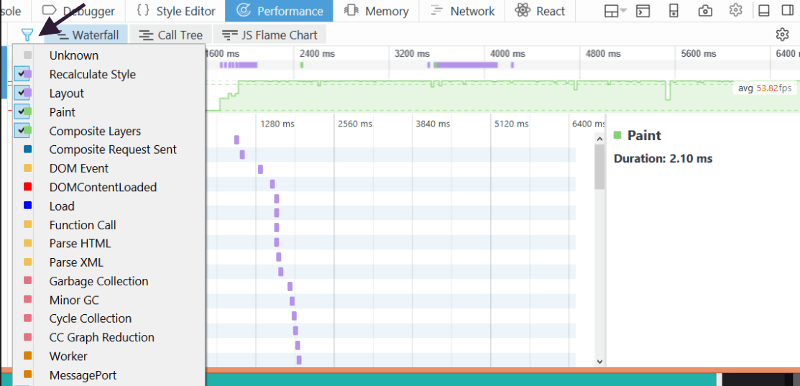
- Yellow bars refer to JavaScript operations. 黄色条表示JavaScript操作。
Purple bars refer to calculating HTML elements’ CSS styles (recalculate styles) and laying out your page (layout). Layout operations are quite expensive for the browser to perform, so if you animate properties that involve repeated layouts (also known as reflows — such as
margin,padding,top,left, etc. — the results could be janky.紫色条表示计算HTML元素CSS样式(重新计算样式)和布局页面(布局)。 布局操作的浏览器执行相当昂贵,所以如果你涉及重复布局动画属性(也称为回流 -如
margin,padding,top,left等-的结果可能是janky。Green bars refer to painting your elements into one or more bitmaps (Paint). Animating properties like
color,background-color,box-shadow, etc., involves costly paint operations, which could be the cause of sluggish animations and poor user experience.绿条表示将元素绘制到一个或多个位图中(绘制)。 诸如
color,background-color,box-shadow等动画属性涉及昂贵的绘画操作,这可能是动画呆滞和用户体验差的原因。
You can also filter the type of data you want to inspect. For instance, I’m interested only in CSS-related data, so I can deselect everything else by clicking on the filter icon at the top left of the screen:
您还可以过滤要检查的数据类型。 例如,我只对与CSS相关的数据感兴趣,因此可以通过单击屏幕左上方的过滤器图标来取消选择其他所有内容:
The big green bar below the Waterfall summary represents information on the framerate.
瀑布摘要下方的绿色大条代表有关帧速率的信息。
A healthy representation would look quite high, but most importantly, consistent — that is, without too many deep gaps.
一个健康的代表看起来很高,但最重要的是,要保持一致-即没有太多的深层空白。
Let’s illustrate this with an example.
让我们用一个例子来说明。
运行中的绩效工具 (The Performance tool in action)
This is a simple CSS animation using the @keyframes keyword. The test page looks like this:
这是使用@keyframes关键字的简单CSS动画 。 测试页面如下所示:
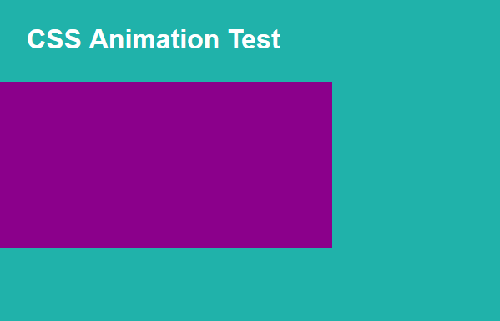
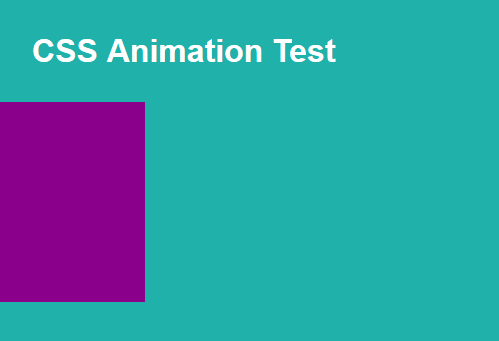
The rectangular purple box slides in and out of view in an infinite cycle.
紫色矩形框可以无限循环地滑入和滑出视图。
I’ve done this by animating the margin-left property of the <div> element that represents the rectangular box on the screen. Here’s what the @keyframes animation block looks like:
我通过设置表示屏幕上矩形框的<div>元素的margin-left属性来实现此目的。 这是@keyframes动画块的外观:
@keyframes slide-margin {
  100% {
    margin-left: 0;
  }
}
The performance data I get from this animation looks like this:
我从该动画中获得的性能数据如下所示:
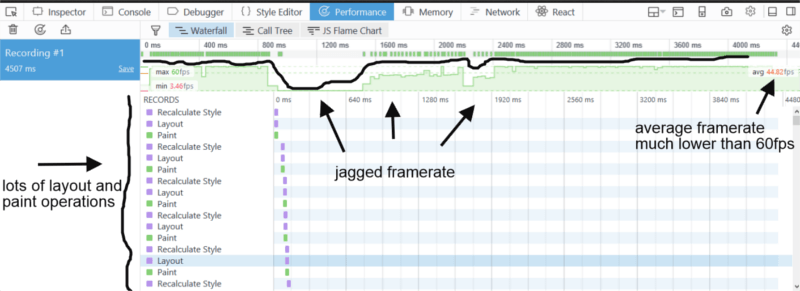
The framerate visual looks a bit jagged and the framerate is an average of 44.82 fps, which is a bit low.
帧速率视觉效果看起来有些参差不齐,帧速率平均为44.82 fps,这有点低。
Also, notice all the layout and paint operations that take place during the animation. These are costly operations the browser performs on its main thread, which has a negative impact on performance.
另外,请注意动画过程中发生的所有布局和绘制操作。 这些是浏览器在其主线程上执行的昂贵操作,这会对性能产生负面影响。
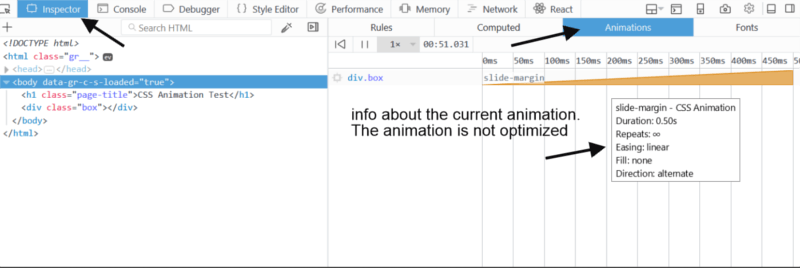
Finally, if you access the Inspector tool, click in the Animation section and hover over the animation name, an information box pops up with all the relevant data about the current animation. If your animation were optimized, there would be a message stating the fact. In this case, there is no message:
最后,如果您访问检查器工具,请在“ 动画”部分中单击并将鼠标悬停在动画名称上,将弹出一个信息框,其中包含有关当前动画的所有相关数据。 如果优化了动画,将显示一条消息说明事实。 在这种情况下,没有消息:
Now, I’m going to change my code and make a new recording as the browser animates the CSS translate3d() property using this @keyframes block:
现在,我将更改代码并进行新记录,因为浏览器使用以下@keyframes块将CSS translate3d()属性设置为动画:
@keyframes slide-three-d {
  100% {
    transform: translate3d(0, 0, 0);
  }
}
This is what the recording of the performance looks like:
这是表演录制的样子:
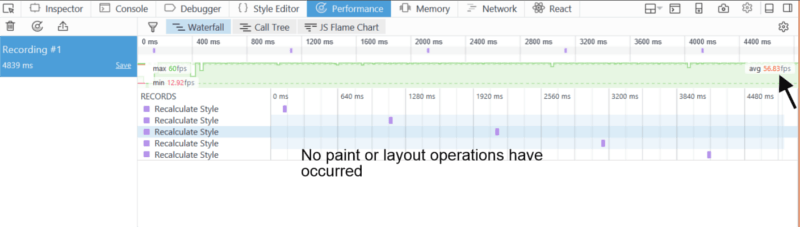
Now the framerate is higher (56.83 fps) and the waterfall is showing no costly layout and paint operations.
现在,帧速率更高(56.83 fps),并且瀑布显示没有昂贵的布局和绘制操作。
Also, if you open the Inspector tab of the developer tools, access the Animation panel and hover the mouse over the name of the animation, you can see something like this:
另外,如果打开开发人员工具的“ 检查器”选项卡,访问“ 动画”面板,并将鼠标悬停在动画名称上,则会看到以下内容:
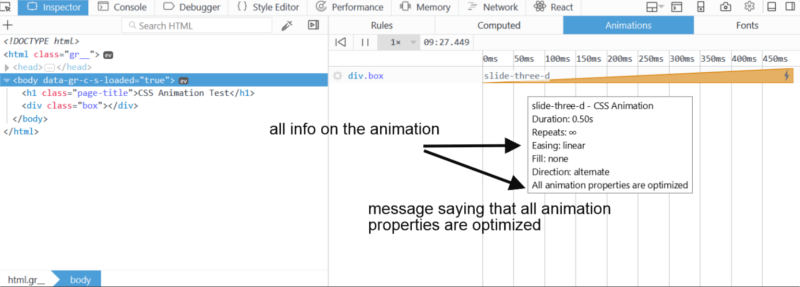
The info box relative to the animation name states that all animations are optimized, which is good news for your website visitors.
相对于动画名称的信息框指出所有动画均已优化,这对您的网站访问者来说是个好消息。
仅对CSS 不透明度进行动画处理, 变形和过滤 (Only Animate CSS Opacity, Transforms and Filters)
You’ve probably heard this piece of advice before, but just in case, it’s worth going over it again: if you want your animations to run smoothly, animate only CSS opacity, transforms and filters. Animating everything else will put your browser under pressure to perform costly tasks in very little time, which often doesn’t yield the best results.
您可能之前已经听过这条建议,但以防万一,值得再次讨论:如果您希望动画平稳运行,请仅对CSS不透明度,转换和过滤器进行动画处理。 动画化所有其他内容会使您的浏览器承受在短时间内执行代价高昂的任务的压力,而这往往无法获得最佳效果。
As the Performance tool in your browser confirms, repeated layout and paint operations are not your friend.
正如浏览器中的“性能”工具确认的那样,重复的布局和绘画操作不是您的朋友。
However, each browser handles CSS properties a bit differently. If you want to know exactly which browser triggers layout and paint operations for which properties (especially when updating values for those properties, which is what is involved in web animation), head over to CSS Triggers.
但是,每种浏览器对CSS属性的处理都略有不同。 如果您想确切地了解哪个浏览器会触发哪些属性的布局和绘制操作(尤其是在更新这些属性的值时,这是Web动画中涉及的内容),请转到CSS触发器 。
To ensure performant animations, a popular approach is to force the browser to hand over the work of changing some properties to the GPU (Graphical Processing Unit), which relieves the browser’s main thread of some pressure and takes advantage of hardware acceleration. You can do so by using the will-change CSS property, or the translateZ(0) and translate3d(0,0,0) hacks. All of these tricks will work, but if you overdo it you could actually get exactly what you’re trying to avoid, i.e., janky animations.
为了确保表现出色的动画效果,一种流行的方法是强制浏览器将更改某些属性的工作移交给GPU(图形处理单元),从而减轻了浏览器主线程的压力,并利用了硬件加速功能。 您可以通过使用will-change CSS属性或translateZ(0)和translate3d(0,0,0) hack来实现。 所有这些技巧都可以使用,但是如果您过度使用它,实际上可以得到您想要避免的东西,例如,怪诞的动画。
I’m not going into the details of hardware acceleration for web animation performance, but if you’d like to dig deeper, take a look at the resources listed below.
我不打算讨论用于Web动画性能的硬件加速的细节,但是如果您想更深入地研究,请查看下面列出的资源。
资源资源 (Resources)
High Performance Animations by Paul Lewis and Paul Irish
保罗·刘易斯和保罗·爱尔兰的高性能动画
CSS animations and transitions performance: looking inside the browser by Max Vujovic
CSS动画和过渡效果: Max Vujovic 在浏览器中浏览
Animations and Performance by Paul Lewis and Sam Thorogood
保罗·刘易斯和山姆·索罗古德的动画和表演
Stick to Compositor-Only Properties and Manage Layer Count by Paul Lewis
保罗·刘易斯(Paul Lewis) 坚持仅使用合成器的属性并管理层数
Tricks for GPU Composited CSS by Sara Soueidan
Sara Soueidan撰写的GPU Composites CSS技巧
An Introduction to the CSS will-change Property by Nick Salloum
Nick Salloum CSS会改变属性简介
Animating CSS properties by MDN
翻译自: https://www.sitepoint.com/check-css-animation-performance-with-the-browsers-dev-tools/
devtools使用


 2057
2057

 被折叠的 条评论
为什么被折叠?
被折叠的 条评论
为什么被折叠?
 到【灌水乐园】发言


