


火狐开发者工具
In this article, we’ll cover Firefox Web Developer Tools (“DevTools”) — a set of tools designed to help developers inspect, debug, profile and optimize the performance of websites and web applications. We’ll particularly look at the tools related to performance, but we’ll also see how to get started using DevTools in general, and learn about some useful settings.
在本文中,我们将介绍Firefox Web开发人员工具(“ DevTools”)—一组旨在帮助开发人员检查,调试,分析和优化网站和Web应用程序性能的工具。 我们将特别关注与性能相关的工具,但还将了解一般如何使用DevTools的入门知识,并了解一些有用的设置。
You can access DevTools in different ways:
您可以通过不同的方式访问DevTools:
click on the hamburger menu at the right of the navigation toolbar, click on Web Developer, then choose the sub-tool you want to use
单击导航工具栏右侧的汉堡菜单,单击Web Developer ,然后选择要使用的子工具
use keyboard combinations, such as Shift+F5 (Windows and macOS) for the Performance tool and Ctrl+Shift+E (Windows) or Cmd+Option+E (macOS) for the Network tool
使用键盘组合,例如Performance工具使用Shift + F5 (Windows和macOS),Network工具使用Ctrl + Shift + E (Windows)或Cmd + Option + E (macOS)
right-click anywhere in the page a choose Inspect Element.
右键单击页面中的任意位置,然后选择检查元素 。
DevTools设置 (DevTools Settings)
The Firefox DevTools have many options that help developers customize their experience, such as the option to Enable time-stamps in the Web Console, or to Disable HTTP Cache, which is used to simulate first-load performance in all pages that have DevTools open.
Firefox DevTools有许多选项可帮助开发人员自定义其体验,例如在Web Console中启用时间戳或禁用HTTP Cache的选项,该选项用于模拟所有打开DevTools的页面的首次加载性能。
You can access the DevTools Settings panel in different ways:
您可以通过不同的方式访问“ DevTools设置”面板:
Start by opening DevTools, next:
首先打开DevTools,然后进行以下操作:
either click the Settings button in the toolbar
或者点击工具栏中的设置按钮
press
F1to show the Settings panel on top of any current tool按
F1以在任何当前工具的顶部显示“设置”面板press Ctrl+Shift+O (Windows and Linux), Cmd+Shift+O (macOS) to show the Settings panel.
按Ctrl + Shift + O (在Windows和Linux中), Cmd + Shift + O (macOS)以显示“设置”面板。
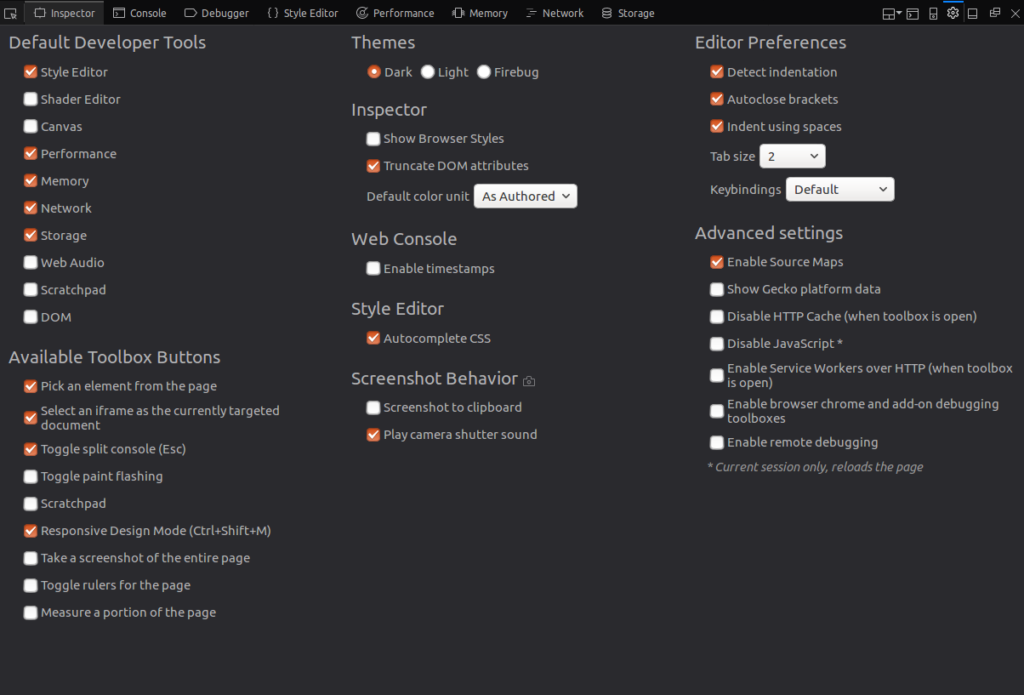
Here you can choose your default tools, the buttons you want to show in the toolbox, themes (dark-light-Firebug) and other advanced settings.
在这里,您可以选择默认工具,要在工具箱中显示的按钮,主题(暗光Firebug)和其他高级设置。
注重性能的工具 (Performance-focused Tools)
When analyzing the performance of a web application, you need to differentiate between load-time performance and run-time performance.
分析Web应用程序的性能时,您需要区分加载时性能和运行时性能。
Load-time performance answers questions like “what resources are taking too much time to load?” When dealing with run-time performance, we need to focus on JavaScript and CSS (CSS animations in particular) so we’re able to see where the code spends most of its time and what’s causing bottlenecks.
加载时性能回答了诸如“哪些资源需要花费太多时间来加载?”之类的问题。 在处理运行时性能时,我们需要专注于JavaScript和CSS(尤其是CSS动画),以便我们能够看到代码大部分时间都花在了哪里以及造成瓶颈的原因。
Let’s look at the Network Monitor and the Performance Tool.
让我们看一下网络监视器和性能工具。
网络监视器 (The Network Monitor)
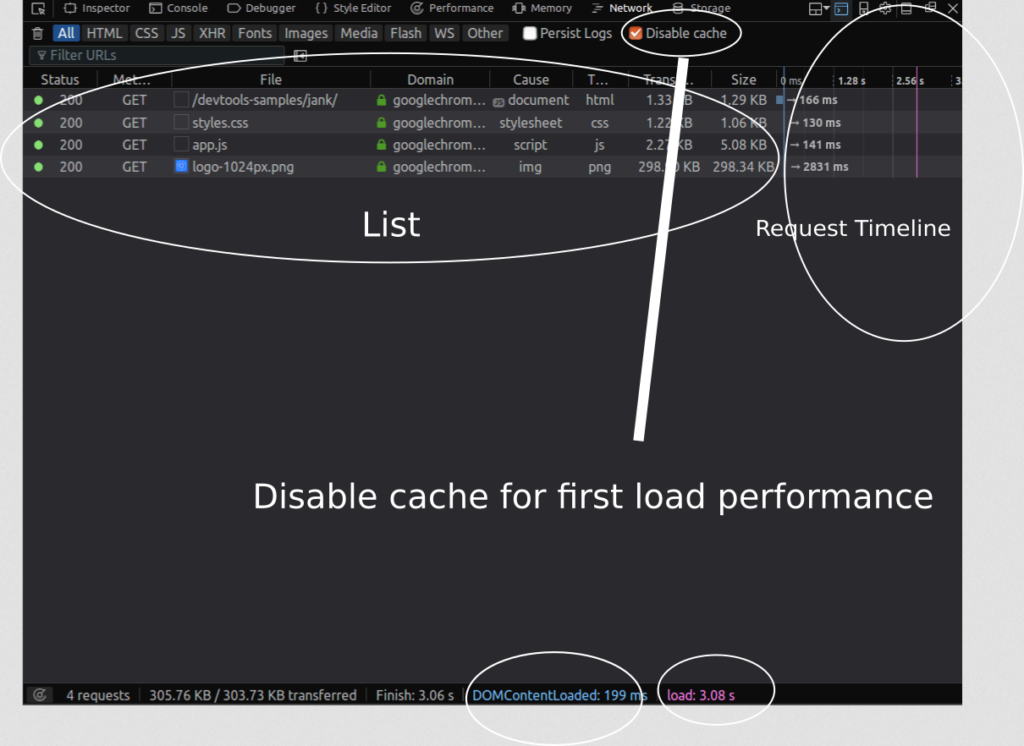
The Network Monitor shows you a tabular view of all network requests that Firefox made (for example, when it’s loading a page, or sending XMLHttpRequests, Fetch API requests etc.).
网络监视器向您显示Firefox发出的所有网络请求的表格视图(例如,在加载页面或发送XMLHttpRequest ,Fetch API请求等)。
It can also display request-related HTTP headers, HTTP responses and cookies, and let you search through them. You can also use it to perform, display and save a performance analysis of the current page load.
它还可以显示与请求相关的HTTP标头,HTTP响应和cookie,并让您搜索它们。 您还可以使用它来执行,显示和保存当前页面加载的性能分析。
In a nutshell, this tool can be used to determine how long the browser takes to download different assets of a web page.
简而言之,该工具可用于确定浏览器下载网页的不同资产所花费的时间
 最低0.47元/天 解锁文章


 892
892


 被折叠的 条评论
为什么被折叠?
被折叠的 条评论
为什么被折叠?
 到【灌水乐园】发言


