poi创建数据透视表
A common pivot table question is "How can I create a pivot table from data that's on separate sheets in my workbook? Sometime people have a workbook set up with a separate sheet for each region, or for each salesperson. Eventually, they want to pull all the data together, and create a summary report in a pivot table, from multiple sheets.
常见的数据透视表问题是“如何从工作簿中不同工作表上的数据创建数据透视表?有时候,人们为每个区域或每个销售人员都设置了一个工作表,并使用单独的工作表。最终,他们希望提取所有数据在一起,并在数据透视表中从多张纸创建汇总报告。
多个合并范围 (Multiple Consolidation Ranges)
Excel has a feature (well hidden Excel 2007) that lets you do this, using Multiple Consolidation Ranges. A pivot table created this way has limited features, and isn't much use in summarizing Excel data.
Excel具有一项功能(隐藏得很好的Excel 2007),可使用多个合并范围来执行此操作。 以这种方式创建的数据透视表功能有限,并且在汇总Excel数据时没有太多用处。
I usually recommend that you move all the data onto one worksheet, if it will fit, or store it in a table in Access, then use that as the source for the pivot table.
我通常建议您将所有数据移动到一个工作表(如果适合)或将其存储在Access中的表中,然后将其用作数据透视表的源。
创建联合查询 (Create a Union Query)
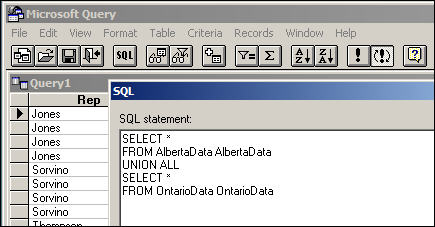
Another solution is to create a Union query from the separate tables, and use that as the source data.
另一个解决方案是从单独的表中创建一个联合查询 ,并将其用作源数据。

With this solution, you'll end up with a normal pivot table, with none of the limitations. However, it's a bit tedious to set up, especially if you have more than a couple of tables.
使用此解决方案,您将得到一个普通的数据透视表,没有任何限制。 但是,设置起来有点繁琐,尤其是当您有多个表时。
自动执行联合查询 (Automate the Union Query)
Instead of setting this up manually, you can use the code in a sample file from Excel MVPs, Kirill Lapin (KL), with amendments by Héctor Miguel Orozco Diaz. (You might remember Héctor's innovative Filter Pivot Table Source Data example, posted earlier this year.)
您可以使用Excel MVP的示例文件Kirill Lapin(KL)中的代码,以及HéctorMiguel Orozco Diaz的修改,而无需手动进行设置。 (您可能还记得今年早些时候发布的Héctor创新的Filter Pivot Table Source Data示例。)
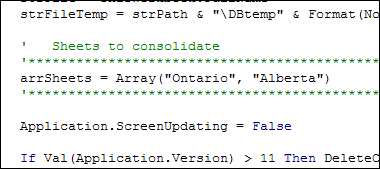
To adjust their sample code to work in your file, you'd replace the sheet names in the CreateConnection code. To go to the CreateConnection code, right-click on the "Create Empty Table" button, and click Assign Macro, then click Edit.
要调整其示例代码以在文件中工作,请在CreateConnection代码中替换工作表名称。 要转到CreateConnection代码,请右键单击“创建空表”按钮,然后单击“分配宏”,然后单击“编辑”。

You can also adjust the location where the pivot table will be added. This line is further down in the CreateConnection code.
您还可以调整将添加数据透视表的位置。 该行在CreateConnection代码中更靠下。

After those small changes, save the code changes. Then go back to Excel, click the button on the worksheet, and a summary pivot table will be automatically created.
完成这些小更改后,保存代码更改。 然后返回Excel,单击工作表上的按钮,将自动创建摘要数据透视表。
下载样本文件 (Download the Sample File)
Thanks Kirill and Héctor, for making a complicated task easier. You can download their sample file from the Contextures website: PT0023 - Pivot Table from Multiple Sheets
感谢Kirill和Héctor使复杂的任务变得更加容易。 您可以从Contextures网站上下载其示例文件: PT0023-多个工作表中的数据透视表
(Also, please check the update section below, for a newer version of the file)
(另外,请检查下面的更新部分,以获取文件的更新版本)
更新- 2011 年 12月 (Update -- December 2011)
The solution described in this article was created as a conceptual prototype and targeted mainly advanced VBA users. The code has minimal error handling and compatibility checks.
本文介绍的解决方案是作为概念性原型创建的,主要针对高级VBA用户。 该代码具有最少的错误处理和兼容性检查。
Given the massive response from all kinds of users willing to adopt this solution in their own applications, we would like suggest a similar solution based on ADO.
考虑到愿意在自己的应用程序中采用此解决方案的各种用户的巨大反响,我们建议提出一种基于ADO的类似解决方案。
优点: (Advantages:)
- No need for temporary file generation 无需临时文件生成
- The code is faster and less prone to errors 代码更快,更不容易出错
缺点: (Disadvantages:)
- No manual refresh of the PivotTable 没有手动刷新数据透视表
- Need to rebuild connection from the scratch to update the cache with new data 需要从头开始重建连接以使用新数据更新缓存
下载ADO示例文件 (Download the ADO Sample File)
You can download the new ADO version of the file from the Contextures website: PT0024 - Pivot Table from Multiple Sheets - ADO version
您可以从Contextures网站上下载文件的新ADO版本: PT0024-多个工作表中的数据透视表-ADO版本
更新-2012年8月28日 (Update -- August 28, 2012)
In the comments below, Kirill posted code that will automatically detect the sheet names. The blog formatting changed his minus sign to a long dash, and also deleted the Less Than Greater Than operator. Here is the correct code, with Kirill's instructions:
在下面的注释中,Kirill发布了将自动检测工作表名称的代码。 博客格式将他的减号更改为长破折号,并且还删除了小于大于大于运算符。 这是正确的代码,带有基里尔的指示:
在代码中,替换以下行: (In the code, replace this line:)
' Sheets to consolidate
'*****************************************************************************
arrSheets = Array("310_BWATTS_P Pastujova", "310_BWATTS_Maria Sanchez")
'*****************************************************************************
使用以下代码: (with the following code:)
' Sheets to consolidate
'*****************************************************************************
Dim ws As Worksheet
ReDim arrSheets(0)
For Each ws In ThisWorkbook.Worksheets
  If ws.Name <> ActiveSheet.Name Then
    arrSheets(UBound(arrSheets)) = ws.Name
    ReDim Preserve arrSheets(UBound(arrSheets) + 1)
  End If
Next ws
ReDim Preserve arrSheets(UBound(arrSheets) - 1)
'*****************************************************************************
翻译自: https://contexturesblog.com/archives/2009/08/24/create-a-pivot-table-from-multiple-sheets/
poi创建数据透视表


 1094
1094

 被折叠的 条评论
为什么被折叠?


