


node.js实时聊天
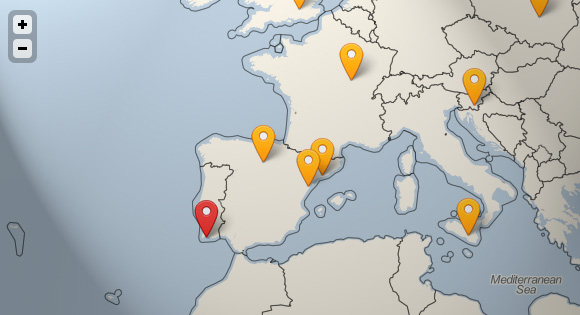
Hi guys! In today’s tutorial we will make a simple real-time application that will determine and show the locations of currently connected users directly on a map. For this purpose we will use Node.js and the HTML5 Geolocation API. As you may know node.js is an asynchronous web server which is built on the Google V8 JavaScript engine and is a perfect solution as a back-end for real-time apps. Our app will let users see each other on the map with the help of the socket.io library that uses Web Sockets (and its alternatives like AJAX long polling for older browsers – more) for a real-time data channel. Our example will work in all modern browsers that support the HTML5 Geolocation API.
嗨,大家好! 在今天的教程中,我们将制作一个简单的实时应用程序,该应用程序将直接在地图上确定并显示当前连接的用户的位置。 为此,我们将使用Node.js和HTML5 Geolocation API 。 如您所知, node.js是基于Google V8 JavaScript引擎构建的异步Web服务器,是作为实时应用程序后端的理想解决方案。 我们的应用程序将在socket.io库的帮助下,使用户在地图上互相看到,该库使用Web套接字(及其替代方案,如较旧的浏览器的AJAX长轮询-更多)作为实时数据通道。 我们的示例将在所有支持HTML5 Geolocation API的现代浏览器中运行。
安装节点 (Installing node)
First, you’ll need to install node.js. You can get pre-compiled Node.js binaries for several platforms from the download section of the official website: http://nodejs.org/download. After the installation is complete you will get access to the node package manager (npm), with the help of which we will install all needed modules for this tutorial. We will use socket.io and node-static, which will serve all the client side files with ease. Go to the directory of your app and run this command in your terminal or command line:
首先,您需要安装node.js。 您可以从官方网站的下载部分http://nodejs.org/download获得针对多个平台的预编译Node.js二进制文件。 安装完成后,您将可以访问节点软件包管理器(npm),在该软件包的帮助下,我们将安装本教程所需的所有模块。 我们将使用socket.io和node-static ,它们将轻松提供所有客户端文件。 转到应用程序的目录,然后在终端或命令行中运行以下命令:
npm install socket.io node-static
Tip: I advice you to install a utility like nodemon that will keep an eye on your files and you won’t need to restart your server after every change:
提示:我建议您安装诸如nodemon之类的实用程序,该实用程序会密切注意文件,并且每次更改后都无需重新启动服务器:
npm install nodemon -g
“-g” means that it will be installed globally and accessible from every node repo.
“ -g”表示它将全局安装并从每个节点存储库均可访问。
HTML (The HTML)
Let’s first create an “index.html” in our public directory.
首先让我们在公共目录中创建一个“ index.html”。
<!doctype html>
<html>

	<head>
		<meta charset="utf-8">
		<meta name="author" content="Dmitri Voronianski">
		<title>Real-Time Geolocation with Web Sockets</title>
		<link href='http://fonts.googleapis.com/css?family=Lato:300,400' rel='stylesheet' type='text/css'>
		<link rel="stylesheet" href="./css/styles.css">
		<link rel="stylesheet" href="http://cdn.leafletjs.com/leaflet-0.4/leaflet.css" />

		<!--[if lt IE 9]>
			<script src="//html5shim.googlecode.com/svn/trunk/html5.js"></script>
		<![endif]-->
	</head>

	<body>
		<div class="wrapper">
		  <header>
		  	<h1>Real-Time Geolocation Service with Node.js</h1>
		  	<div class="description">Using HTML5 Geolocation API and Web Sockets to show connected locations.</div>
		  </header>

		  <div class="app">
		  	<div class="loading"></div>
		  	<div id="infobox" class="infobox"></div>
		  	<div id="map">To get this app to work you need to share your geolocation.</div>
		  </div>
		</div>

		<script src="https://ajax.googleapis.com/ajax/libs/jquery/1.8.0/jquery.min.js"></script>
		<script src="./js/lib/leaflet.js"></script>
		<script src="/socket.io/socket.io.js"></script>
		<script src="./js/application.js"></script>
	</body>

</html>
As you can see it’s pretty simple. For rendering our map on the page we will use an incredible open-source JavaScript library for interactive maps – Leaflet.js. It’s free and highly customizable. The API documentation is available on the website. Our styles.css file is inside the “./public/css/” folder. It will include some simple styles for the app. The leaflet.css in the same folder contains the styles for the map.
如您所见,这非常简单。 为了在页面上呈现地图,我们将使用令人难以置信的开源JavaScript库(用于交互式地图)– Leaflet.js 。 它是免费的且高度可定制的。 API文档可在网站上找到。 我们的styles.css文件位于“ ./public/css/”文件夹中。 它将包括该应用程序的一些简单样式。 同一文件夹中的leaflet.css包含地图的样式。
服务器端 (Server side)
Now we are ready to start with the back-end of our app. Let’s take a look at “server.js”:
现在,我们准备从应用程序的后端开始。 让我们看一下“ server.js”:
// including libraries
var http = require('http');
var static = require('node-static');
var app = http.createServer(handler);
var io = require('socket.io').listen(app);

// define port
var port = 8080;

// make html, js & css files accessible
var files = new static.Server('./public');

// serve files on request
function handler(request, response) {
	request.addListener('end', function() {
		files.serve(request, response);
	});
}

// listen for incoming connections from client
io.sockets.on('connection', function (socket) {

  // start listening for coords
  socket.on('send:coords', function (data) {

  	// broadcast your coordinates to everyone except you
  	socket.broadcast.emit('load:coords', data);
  });
});

// starts app on specified port
app.listen(port);
console.log('Your server goes on localhost:' + port);
The code is not complicated at all; everything that it does is serving files and listening to the data from the client. Now we can start our app from the terminal or command line and take a look:
代码一点也不复杂。 它所做的一切都是提供文件并监听来自客户端的数据。 现在,我们可以从终端或命令行启动我们的应用程序,然后看一下:
node server.js
Or, if you have followed my advice and used nodemon, write this:
或者,如果您遵循了我的建议并使用了nodemon,请编写以下代码:
nodemon server.js
Now go to localhost:8080 in your browser (you can change the port to whatever you like). Everything will be static because our main JavaScript function is not ready, yet.
现在,在浏览器中转到localhost:8080 (您可以将端口更改为所需的端口)。 因为我们的主要JavaScript函数尚未准备好,所以所有内容都是静态的。
客户端 (The Client Side)
It’s time to open the “./public/js/application.js” file and to write a couple of functions (we’ll be using jQuery):
是时候打开“ ./public/js/application.js”文件并编写几个函数了(我们将使用jQuery):
$(function() {
// generate unique user id
var userId = Math.random().toString(16).substring(2,15);
var socket = io.connect("/");
var map;
var info = $("#infobox");
var doc = $(document);
// custom marker's icon styles
var tinyIcon = L.Icon.extend({
options: {
shadowUrl: "../assets/marker-shadow.png",
iconSize: [25, 39],
iconAnchor: [12, 36],
shadowSize: [41, 41],
shadowAnchor: [12, 38],
popupAnchor: [0, -30]
}
});
var redIcon = new tinyIcon({ iconUrl: "../assets/marker-red.png" });
var yellowIcon = new tinyIcon({ iconUrl: "../assets/marker-yellow.png" });
var sentData = {}
var connects = {};
var markers = {};
var active = false;
socket.on("load:coords", function(data) {
// remember users id to show marker only once
if (!(data.id in connects)) {
setMarker(data);
}
connects[data.id] = data;
connects[data.id].updated = $.now(); // shorthand for (new Date).getTime()
});
// check whether browser supports geolocation api
if (navigator.geolocation) {
navigator.geolocation.getCurrentPosition(positionSuccess, positionError, { enableHighAccuracy: true });
} else {
$(".map").text("Your browser is out of fashion, there's no geolocation!");
}
function positionSuccess(position) {
var lat = position.coords.latitude;
var lng = position.coords.longitude;
var acr = position.coords.accuracy;
// mark user's position
var userMarker = L.marker([lat, lng], {
icon: redIcon
});
// load leaflet map
map = L.map("map");
// leaflet API key tiler
L.tileLayer("http://{s}.tile.cloudmade.com/BC9A493B41014CAABB98F0471D759707/997/256/{z}/{x}/{y}.png", { maxZoom: 18, detectRetina: true }).addTo(map);
// set map bounds
map.fitWorld();
userMarker.addTo(map);
userMarker.bindPopup("You are there! Your ID is " + userId + "
").openPopup();
// send coords on when user is active
doc.on("mousemove", function() {
active = true;
sentData = {
id: userId,
active: active,
coords: [{
lat: lat,
lng: lng,
acr: acr
}]
}
socket.emit("send:coords", sentData);
});
}
doc.bind("mouseup mouseleave", function() {
active = false;
});
// showing markers for connections
function setMarker(data) {
for (i = 0; i < data.coords.length; i++) {
var marker = L.marker([data.coords[i].lat, data.coords[i].lng], { icon: yellowIcon }).addTo(map);
marker.bindPopup("One more external user is here!
");
markers[data.id] = marker;
}
}
// handle geolocation api errors
function positionError(error) {
var errors = {
1: "Authorization fails", // permission denied
2: "Can't detect your location", //position unavailable
3: "Connection timeout" // timeout
};
showError("Error:" + errors[error.code]);
}
function showError(msg) {
info.addClass("error").text(msg);
}
// delete inactive users every 15 sec
setInterval(function() {
for (ident in connects){
if ($.now() - connects[ident].updated > 15000) {
delete connects[ident];
map.removeLayer(markers[ident]);
}
}
}, 15000);
});
Magic happens when we use socket.emit to send a message to our node web server on every mouse move. It means that our user is active on the page. We also receive the data from the server with socket.on and after getting initialize markers on the map. The main things that we need for the markers are the latitude and longitude which we receive from the browser. If the user is inactive for more then 15 seconds we remove their marker from our map. If the user’s browser doesn’t support the Geolocation API we’ll show a message that the browser is out-of-date. You can read more about the HTML5 Geolocation API here: Geolocation – Dive Into HTML5.
当我们使用socket.emit每次鼠标移动将消息发送到节点Web服务器时,魔术就会发生。 这意味着我们的用户在页面上处于活动状态。 我们还会通过socket.on以及在地图上获取初始化标记后从服务器接收数据。 标记所需的主要内容是从浏览器接收到的纬度和经度。 如果用户闲置超过15秒钟,我们将从地图上删除其标记。 如果用户的浏览器不支持Geolocation API,我们将显示一条消息,说明该浏览器已过期。 您可以在此处阅读有关HTML5 Geolocation API的更多信息: Geolocation –深入HTML5 。
演示库 (Demo Repository)
You can take a look at the whole app in my github repo, clone it and experiment with it locally. If you have questions feel free to ask in the comments or you can also e-mail me. Thanks!
您可以在我的github存储库中查看整个应用程序,对其进行克隆并在本地进行试验。 如果您有任何疑问,请随时在评论中提出,或者也可以给我发送电子邮件。 谢谢!
Please note that the demo might not load properly sometimes due to server overload.
请注意,有时由于服务器过载,该演示可能无法正确加载。
翻译自: https://tympanus.net/codrops/2012/10/11/real-time-geolocation-service-with-node-js/
node.js实时聊天


 1663
1663


 被折叠的 条评论
为什么被折叠?
被折叠的 条评论
为什么被折叠?
 到【灌水乐园】发言


