


Include captions in your Microsoft Excel graphs to provide rich and meaningful labels. The labels can be used to display extra information that is not plotted on the graph. By linking them to cell values, you can make these captions dynamic.
在Microsoft Excel图形中包括标题以提供丰富且有意义的标签。 标签可用于显示未在图形上绘制的其他信息。 通过将它们链接到单元格值,可以使这些标题动态化。
为什么在Excel图形中包含字幕? (Why Include Captions in Excel Graphs?)
When you create a chart in Excel, you are provided with label elements. These include the chart title, data labels, and axis titles. These labels can be very useful for displaying extra information in the chart, especially when you use cell values for Excel chart labels.
在Excel中创建图表时,会为您提供标签元素。 这些包括图表标题,数据标签和轴标题。 这些标签对于在图表中显示其他信息非常有用,尤其是当您将单元格值用于Excel图表标签时 。
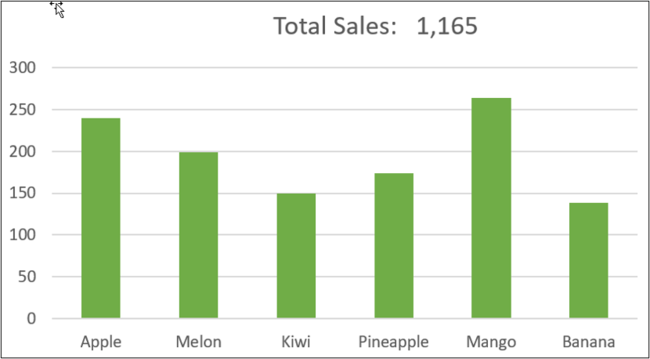
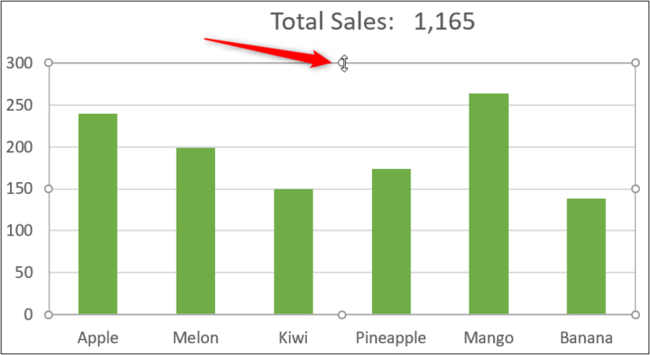
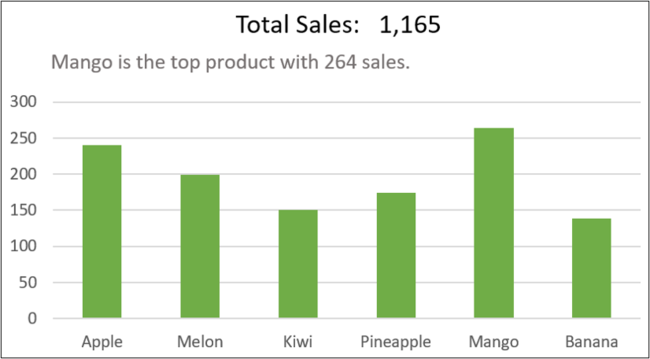
The following chart uses a link to a cell value to show the total cells in the chart title.
下图使用指向单元格值的链接显示图表标题中的总单元格。
However, you are not limited to these built-in labels. You can include captions in Excel graphs by adding text boxes.
但是,您不仅限于这些内置标签。 您可以通过添加文本框将标题包括在Excel图形中。
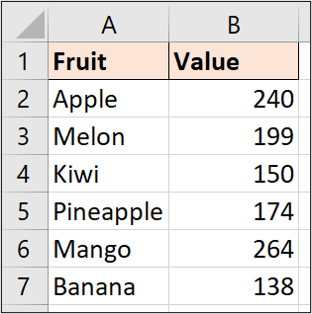
This chart was created using the following set of data.
该图表是使用以下数据集创建的。
创建标题文本 (Create the Caption Text)
Let’s add a caption to tell more of the story of this data. We will add a caption to convey the top product and its sales total.
让我们添加一个标题来讲述更多有关此数据的故事。 我们将添加标题来传达顶级产品及其销售总额。
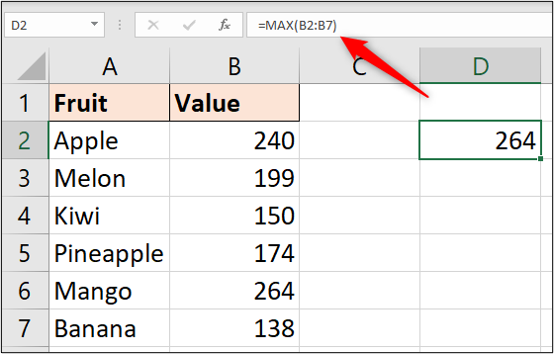
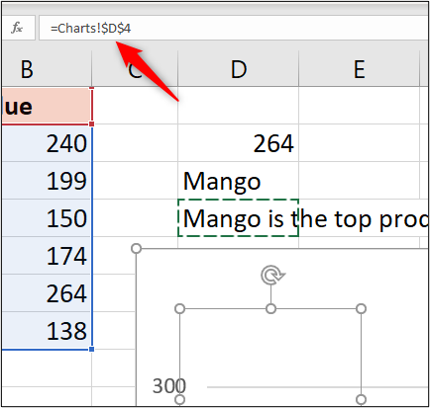
First, we need to calculate the data we want to display. In cell D2, the following formula is used to return the maximum sales value.
首先,我们需要计算要显示的数据。 在单元格D2中,以下公式用于返回最大销售价值。
=MAX(B2:B7)
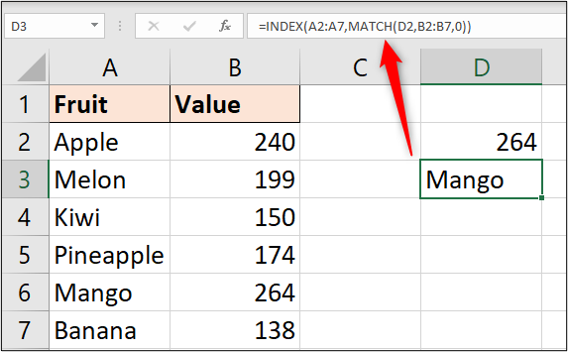
We can then use a formula in cell D3 with the INDEX and MATCH combination to return the name of that product.
然后,我们可以在单元格D3中使用带有INDEX和MATCH组合的公式来返回该产品的名称。
=INDEX(A2:A7,MATCH(D2,B2:B7,0))
In cell D4, we can make a creative caption from these calculated values.
在单元格D4中,我们可以根据这些计算出的值来制作广告标题。
=D3&" is the top product with "&D2&" sales."

将标题添加到Excel图形 (Add Captions to an Excel Graph)
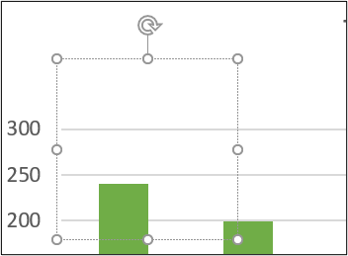
Before we add the caption, we need to resize the plot area of this chart to make some space for it.
在添加标题之前,我们需要调整此图表的绘图区域的大小以为其留出一些空间。
Click on the plot area to select it, then drag the resize handle to make room between the chart title and the chart values.
单击绘图区域以将其选中,然后拖动调整大小手柄以在图表标题和图表值之间留出空间。
We will include the caption by inserting a text box. Click Insert > Text Box and then select the chart to insert it.
我们将通过插入文本框来包含标题。 单击插入>文本框,然后选择要插入的图表。
Next, click in the Formula Bar, type “=” and then select cell D4 (the cell containing the caption text).
接下来,在编辑栏中单击,键入“ =”,然后选择单元格D4(包含标题文本的单元格)。
Press the Enter key.
按Enter键。
The caption text is shown in the text box and can be moved and resized into an appropriate position on the chart.
标题文本显示在文本框中,可以移动并调整大小到图表上的适当位置。
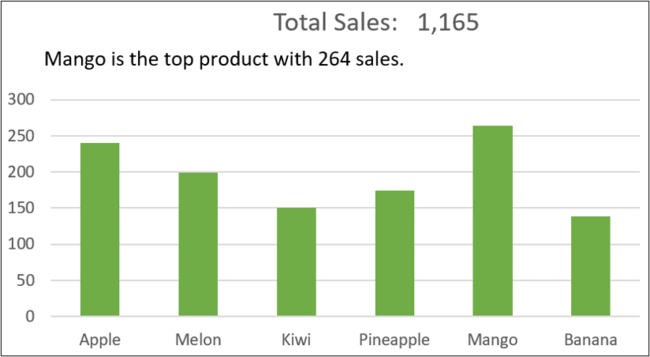
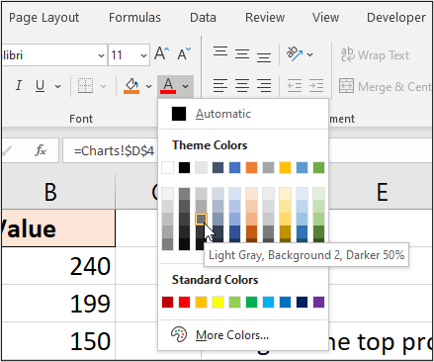
To finish the caption, format it to a light grey so that it is not as impactful as the chart title. Click Home, the list arrow for “Font Color,” then select a light grey.
要完成标题,请将其格式设置为浅灰色,这样它就不会像图表标题那样具有影响力。 单击主页,“字体颜色”的列表箭头,然后选择浅灰色。
This is one example of including captions, but it is up to you to be creative. You can show whatever information you want your chart to convey to go beyond the standard charts.
这是包含字幕的一个示例,但是您要有创造力。 您可以显示希望图表传达的信息,以超越标准图表。
翻译自: https://www.howtogeek.com/673657/how-to-include-captions-in-microsoft-excel-graphs/


 5万+
5万+

 被折叠的 条评论
为什么被折叠?
被折叠的 条评论
为什么被折叠?
 到【灌水乐园】发言


