


pvs linux
安装 (Installation)
There are different ways to install PVS-Studio under Linux, depending on your distro type. The most convenient and preferred method is to use the repository, since it allows auto-updating the analyzer upon releasing new versions. Another option is to use the installation package, which you can get here.
在Linux下安装PVS-Studio的方式不同,具体取决于发行版类型。 最方便,首选的方法是使用存储库,因为它可以在发布新版本时自动更新分析器。 另一种选择是使用安装包,您可以在此处获得。
The installation commands differ depending on the Linux distro you are using. For instance, this is how installation from the repository under Debian-based systems looks like:
安装命令因所使用的Linux发行版而异。 例如,这是在基于Debian的系统下从存储库进行安装的样子:
wget -q -O - https://files.viva64.com/etc/pubkey.txt | sudo apt-key add -

sudo wget -O /etc/apt/sources.list.d/viva64.list \
https://files.viva64.com/etc/viva64.list

sudo apt update
sudo apt install pvs-studio
To install PVS-Studio from the downloadable package, you can use the gdebi utility:
要从可下载的软件包中安装PVS-Studio,可以使用gdebi实用程序:
sudo gdebi pvs-studio-VERSION.debThe installation process is described in greater detail in the "Installing and updating PVS-Studio on Linux" documentation section. You can also find information on non-Debian systems there.
在“ 在Linux上安装和更新PVS-Studio ”文档部分中对安装过程进行了更详细的描述。 您还可以在此处找到有关非Debian系统的信息。
Once PVS-Studio is installed, you need to enter license data. Here's the command for that:
安装PVS-Studio后,您需要输入许可证数据。 这是该命令:
pvs-studio-analyzer credentials NAME KEY [-o LIC-FILE]If you need a trial key, you can get it at the "Download and evaluate PVS-Studio" page.
如果需要试用版密钥,可以在“ 下载并评估PVS-Studio ”页面上获得。
检查项目 (Checking your project)
Once you get the analyzer installed, you can start checking projects. There are two main ways to do this:
一旦安装了分析仪,就可以开始检查项目。 有两种主要方法可以做到这一点:
- Compilation monitoring. 编译监视。
- Running from build systems directly. 直接从构建系统运行。
Let's talk about the first way. To launch the monitoring under Linux, you need the strace utility. PVS-Studio uses it to collect a list and parameters of processes, which were launched during the build.
让我们谈谈第一种方法。 要在Linux下启动监视,您需要strace实用程序。 PVS-Studio使用它来收集在构建过程中启动的过程的列表和参数。
Use the command below to initiate the build:
使用以下命令启动构建:
pvs-studio-analyzer trace -- makeHere, make is used, but any other command that you're running to build your project can be in its place. If needed, you can pass command-line parameters to it in the usual way.
在这里,使用了make ,但是正在运行的用于构建项目的任何其他命令都可以代替。 如果需要,可以按常规方式将命令行参数传递给它。
After the build, strace will create a file, which the analyzer will then use to check the source code. To start the analysis, use the command below.
构建完成后, strace将创建一个文件,分析器随后将使用该文件检查源代码。 要开始分析,请使用以下命令。
pvs-studio-analyzer analyze -o /path/to/project.logAs a result, an encoded log file will be generated, which you can convert to one of supported formats. We'll talk about working with reports later.
结果,将生成一个编码日志文件,您可以将其转换为支持的格式之一。 稍后我们将讨论处理报告。
Besides strace, you can base the analysis on the compile_commands.json (JSON Compilation Database) file. Many build systems have built-in means of exporting compilation commands, or you could use the BEAR utility to do this. Here's the command to launch the analysis in this case:
除了strace之外,您还可以基于compile_commands.json (JSON编译数据库)文件进行分析。 许多构建系统具有导出编译命令的内置方法,或者您可以使用BEAR实用程序来执行此操作。 在这种情况下,以下是启动分析的命令:
pvs-studio-analyzer analyze –f /path/to/compile_commands.jsonNote that the analyzer recognizes the compiler, used in the build process, by its executable name. If you get the «No compilation units found» error whilst attempting to analyze your project, try explicitly specifying the name of your compiler via the –compiler or –c command-line key:
请注意,分析器会通过可执行文件名来识别在构建过程中使用的编译器。 如果在尝试分析项目时遇到“找不到编译单元”错误,请尝试通过–compiler或–c命令行键显式指定编译器的名称:
pvs-studio-analyzer analyze -c MyCompilerYou may need this if you're using cross-compilation, or if your compiler has a non-standard executable name.
如果您使用交叉编译,或者您的编译器具有非标准的可执行文件名称,则可能需要此功能。
Besides monitoring mode, you can integrate the analyzer directly into your build system or IDE. Our official GitHub repository provides example projects where the integration has already been configured:
除了监视模式外,您还可以将分析器直接集成到构建系统或IDE中。 我们的官方GitHub存储库提供了示例项目,其中已经配置了集成:
To learn more on running the analyzer under Linux, see the documentation.
要了解有关在Linux下运行分析仪的更多信息,请参阅文档 。
处理报告 (Working with reports)
After checking a project, the analyzer creates an encoded report. To convert it to one of supported formats, you need to use the plog-converter utility, which comes with the PVS-Studio installation.
检查项目后,分析器将创建一个编码报告。 要将其转换为受支持的格式之一,您需要使用PVS-Studio安装随附的plog-converter实用程序。
Here's a list of supported formats:
以下是受支持格式的列表:
xml-a convenient format for further processing of the results of the analysis, which is supported supported by the plugin for SonarQube;
xml-一种方便的格式,用于进一步处理分析结果, SonarQube插件支持该格式 ;
- csv — file stores tabular data (numbers and text) in plain text; csv-文件以纯文本格式存储表格数据(数字和文本);
- errorfile is the output format of the gcc and clang; errorfile是gcc和clang的输出格式;
- tasklist — an error format that can be opened in QtCreator; 任务列表-一种错误格式,可以在QtCreator中打开;
- html — html report with a short description of the analysis results; html —带有分析结果简短描述的html报告;
- fullhtml — report with sorting of the analysis results according to the different parameters and navigation along the source code. fullhtml —报告,其中根据不同的参数对分析结果进行排序,并沿源代码进行导航。
The fullhtml format is the most convenient one for viewing the report, since it allows jumping to the line of code, corresponding to the warning you're interested in. The following command allows you to convert the report to this format:
fullhtml格式是查看报告最方便的格式,因为它允许跳到与您感兴趣的警告相对应的代码行。以下命令可让您将报告转换为这种格式:
plog-converter -a GA:1,2 -t fullhtml /path/project.log -o /path/report_dirWhen you launch it, a newly created directory named /path/report_dir will contain all the report files.
启动它时,一个名为/ path / report_dir的新创建目录将包含所有报告文件。
Pay attention to the -a parameter. It allows you to specify, which warnings should appear in the resulting report. It is convenient if you need to filter the analyzer's output. The above command will create a report, which will contain only general analysis messages of the first and second certainty levels (High and Medium).
注意-a参数。 它允许您指定哪些警告应出现在结果报告中。 如果您需要对分析仪的输出进行过滤,将非常方便。 上面的命令将创建一个报告,该报告将仅包含第一和第二确定性级别( 高和中 )的常规分析消息。
An example report:
报告示例:
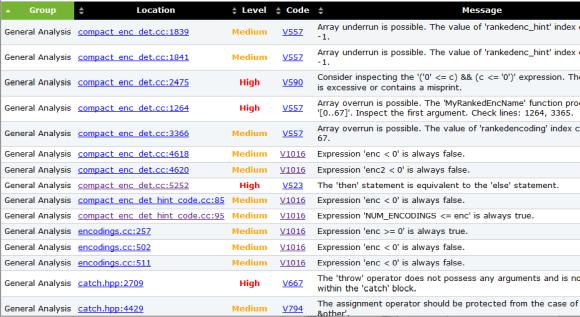
By clicking within a message's Location cell, you can jump to the corresponding line of code:
通过单击消息的“ 位置”单元格,可以跳至相应的代码行:
By clicking the diagnostic code in the Code column, you can open documentation on this diagnostic.
通过单击“代码”列中的诊断代码,可以打开有关此诊断的文档。
禁止分析仪警告 (Suppressing analyzer warnings)
When using any static analyzer to check source code, you might get false positives, or simply undesirable noise warnings. PVS-Studio has means of suppressing such messages. To target individual warnings, you can use one of the methods described in the "Suppression of false alarms" documentation article.
当使用任何静态分析器检查源代码时,您可能会得到误报,或者仅仅是不想要的噪声警告。 PVS-Studio具有抑制此类消息的方法。 若要针对单个警告,可以使用“ 抑制错误警报 ”文档文章中介绍的方法之一。
Also, when checking old code you might want to suppress all warnings. As a rule, you may need this if you only want to check new code that you add to an existing codebase. To do this, use the suppress parameter of the pvs-studio-analyzer utility.
另外,在检查旧代码时,您可能希望禁止显示所有警告。 通常,如果只想检查添加到现有代码库中的新代码,则可能需要这样做。 为此,请使用pvs-studio-analyzer实用程序的抑制参数。
You can mass-suppress warnings in a report by using this command:
您可以使用以下命令在报告中批量禁止显示警告:
pvs-studio-analyzer suppress /path/to/report.logInformation on suppressed warnings is stored in a file named suppress_base.json, which is located next to the project. Such messages are excluded from reports on subsequent checks.
关于抑制的警告的信息存储在项目旁边的名为prevent_base.json的文件中。 此类消息将从后续检查的报告中排除。
This mechanism is described in detail here.
这个机制详细描述在这里 。
结论 (Conclusion)
This was a brief introduction into using PVS-Studio under Linux. I hope it was useful and managed to answer the most frequent questions. If you need more information on the topic of this article, refer to documentation here.
这是在Linux下使用PVS-Studio的简要介绍。 我希望它是有用的,并且能够回答最常见的问题。 如果您需要有关本文主题的更多信息,请参考此处的文档。
pvs linux


 3496
3496


 被折叠的 条评论
为什么被折叠?
被折叠的 条评论
为什么被折叠?
 到【灌水乐园】发言


