


pvs-stdio ue4

This article will tell you how to launch analysis of an embedded project and how to work with the analyzer's report. The PVS-Studio analyzer supports a number of compilers for embedded systems. The current version allows checking projects built with one of the following compilers under Window, Linux, and macOS:
本文将告诉您如何启动对嵌入式项目的分析以及如何使用分析器的报告。 PVS-Studio分析仪支持许多用于嵌入式系统的编译器。 当前版本允许在Window,Linux和macOS下检查使用以下编译器之一构建的项目:
安装 (Installation)
The installation procedure depends on the operating system you use in development. Under Linux, you can install the analyzer from either the repository, or the installation package.
安装过程取决于您在开发中使用的操作系统。 在Linux下,您可以从存储库或安装包中安装分析器。
For example, on a Debian-based system:
例如,在基于Debian的系统上:
wget -q -O - https://files.viva64.com/etc/pubkey.txt | sudo apt-key add -

sudo wget -O /etc/apt/sources.list.d/viva64.list \
https://files.viva64.com/etc/viva64.list

sudo apt update
sudo apt install pvs-studio
or
要么
sudo gdebi pvs-studio-VERSION.debUnder macOS, you can use Homebrew for installation and updating:
在macOS下,您可以使用Homebrew进行安装和更新:
brew install viva64/pvs-studio/pvs-studio
brew upgrade pvs-studio
Another option – installing from the dmg package, or unpacking from the archive manually.
另一个选择-从dmg软件包安装,或从归档手动解压缩。
Under Windows, you need to use the installer:
在Windows下,您需要使用安装程序:
You can download installation packages for each supported system, as well as request a trial key, should you need it, at the "Download and evaluate PVS-Studio" page.
您可以在“ 下载和评估PVS-Studio ”页面上下载每个受支持系统的安装软件包,并在需要时请求试用密钥。
Once the installation is done, you need to enter the license key. The "How to enter the PVS-Studio License and what's the next move" documentation article describes this process in detail in regards to different platforms.
安装完成后,您需要输入许可证密钥。 “ 如何输入PVS-Studio许可证以及下一步行动 ”文档文章详细介绍了有关不同平台的此过程。
检查项目 (Checking your Project)
Checking projects built for embedded systems is similar to checking those developed for Windows, Linux, or macOS.
检查为嵌入式系统构建的项目类似于检查为Windows,Linux或macOS开发的项目。
Options available in Linux are described in the "Getting Started with the PVS-Studio Static Analyzer for C++ Development under Linux" article. Keep in mind that embedded projects are cross-compiled, and your compiler can have a non-standard name. Due to this, you might need to specify it when launching the analysis, which you can do via the –compiler, or –c, command-line key.
在“ Linux 下用于C ++开发的PVS-Studio静态分析器入门 ”一文中介绍了Linux中可用的选项。 请记住,嵌入式项目是交叉编译的,并且您的编译器可以具有非标准名称。 因此,您可能需要在启动分析时指定它,可以通过–compiler或–c命令行键来进行指定。
pvs-studio-analyzer analyze -c MyCompilerUsing it is necessary if the analyzer can't detect the compiler type, that is, if it issues the «No compilation units found» error.
如果分析器无法检测到编译器类型,即发出“未找到编译单元”错误,则必须使用该选项。
Since the target platform differs from the development one due to cross-compilation, you'll probably also need to specify the target platform via the --platform key, along with the preprocessor type (--preprocessor).
由于目标平台由于交叉编译而不同于开发平台,因此您可能还需要通过--platform键以及预处理器类型( --preprocessor )指定目标平台。
Supported platforms: win32, x64, linux32, linux64, macos, arm.
支持的平台: win32,x64,linux32,linux64,macos,arm。
Supported prerocessors: gcc, clang, keil.
支持的处理器: gcc,clang,keil。
Under Linux, the linux64 platform and the gcc preprocessor are the defaults.
在Linux下, linux64平台和gcc预处理器是默认设置。
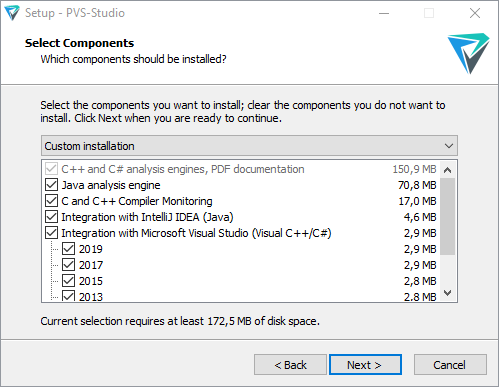
If you're using Windows, you can check your project in the compiler monitoring mode. To do so, use the "C and C++ Compiler Monitoring UI" utility, which comes with the analyzer. To start monitoring, go to the Tools menu and pick Analyze Your Files... This dialog will open:
如果使用Windows,则可以在编译器监视模式下检查项目。 为此,请使用分析仪随附的“ C and C ++ Compiler Monitoring UI ”实用程序。 要开始监视,请转到“ 工具”菜单,然后选择“ 分析文件...”,将打开以下对话框:
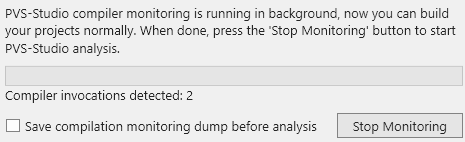
Click the "Start Monitoring" button and start building your project. When the build finishes, click the "Stop Monitoring" button in the dialog window located in the bottom-right corner of the screen:
单击“ 开始监视 ”按钮,然后开始构建您的项目。 构建完成后,单击位于屏幕右下角的对话框窗口中的“ 停止监视 ”按钮:
The main window of the "C and C++ Compiler Monitoring UI" utility allows you to view the analysis results.
“ C and C ++ Compiler Monitoring UI ”实用程序的主窗口允许您查看分析结果。
Also, it is possible to start the analysis from the command line by using the CLMonitor utility. Here's the command which will initiate monitoring:
另外,可以使用CLMonitor实用程序从命令行开始分析。 这是将启动监视的命令:
CLMonitor.exe monitorAfter the build, start it again in analysis mode:
构建之后,以分析模式重新启动它:
CLMonitor.exe analyze -l "<path>\out.plog"The analyzer will check your project and save the results to the file specified via the -l key.
分析器将检查您的项目,并将结果保存到通过-l键指定的文件中。
See also "Compiler Monitoring System in PVS-Studio".
另请参见“ PVS-Studio中的编译器监视系统 ”。
处理报告 (Working with Reports)
To view the report under Linux, you need to convert the log file, generated by the analyzer, into one of supported formats. Use the plog-converter utility to do this. For example, you can generate an HTML report, which allows you to view source code, with this command:
要在Linux下查看报告,您需要将分析器生成的日志文件转换为支持的格式之一。 使用plog-converter实用程序执行此操作。 例如,您可以使用以下命令生成HTML报告,该报告允许您查看源代码:
plog-converter -a GA:1,2 -t fullhtml /path/project.log -o /path/report_dirReport conversion is described in more detail in the "Getting Started with the PVS-Studio Static Analyzer for C++ Development under Linux" article.
在“ Linux下用于C ++开发的PVS-Studio静态分析器入门 ”一文中详细描述了报告转换。
The Windows version also has a utility named PlogConverter, which is similar in usage to its Linux counterpart:
Windows版本还具有一个名为PlogConverter的实用程序,其用法与Linux相似:
PlogConverter.exe <path>\out.plog --renderTypes= FullHtml --analyzer=GA:1,2or
要么
PlogConverter.exe D:\Projct\out.plog -t FullHtml -a GA:1,2You can also view reports in plog format with the "C and C++ Compiler Monitoring UI" utility via the File->Open PVS-Studio Log... menu command.
您也可以通过File-> Open PVS-Studio Log ...菜单命令,使用“ C and C ++ Compiler Monitoring UI ”实用程序以plog格式查看报告。
Example:
例:

If you need to, you can export the report to one of supported formats via the utility's File menu.
如果需要,可以通过实用程序的“ 文件”菜单将报告导出为支持的格式之一。
MISRA编码标准 (MISRA coding standard)
PVS-Studio classifies its warnings according to CWE and SEI CERT, which works quite well for static security testing (SAST) of regular apps. However, embedded systems have different security requirements, covered by a specially developed MISRA standard. The current PVS-Studio version partially supports MISRA C and MISRA C++. You can see the regularly expanding list of supported rules here.
PVS-Studio根据CWE和SEI CERT对警告进行分类,对于常规应用程序的静态安全测试( SAST )而言,PVS-Studio非常有效。 但是,嵌入式系统具有不同的安全性要求,这些要求由专门开发的MISRA标准涵盖。 当前的PVS-Studio版本部分支持MISRA C和MISRA C ++。 您可以在此处查看受支持规则的定期扩展列表。
Using MISRA rules when checking non-embedded projects is usually a bad idea, due to the standard's specifics. In most cases, if the code wasn't initially MISRA-oriented, the check would result in many false positives and generally noise warnings. Thus, MISRA rules are off by default.
由于标准的特殊性,在检查非嵌入式项目时使用MISRA规则通常是一个坏主意。 在大多数情况下,如果代码最初不是面向MISRA的,则检查将导致许多误报和通常的噪声警告。 因此,MISRA规则默认为关闭。
To enable MISRA under Linux, run the analysis with the -a key and pass a numeric parameter, according to the desired mode. This parameter is a combination of bit fields:
要在Linux下启用MISRA,请根据所需模式使用-a键运行分析并传递数字参数。 此参数是位字段的组合:
-a [MODE], --analysis-mode [MODE]
        MODE defines the type of warnings:
        1 - 64-bit errors;
        2 - reserved;
        4 - General Analysis;
        8 - Micro-optimizations;
        16 - Customers Specific Requests;
        32 - MISRA.
        Modes can be combined by adding the values
        Default: 4
Example (with GA and MISRA rules enabled):
示例(启用了GA和MISRA规则):
pvs-studio-analyzer analyze -a 36 -o /path/report.logAlso, you need to tell plog-converter to include MISRA warnings in the resulting report:
另外,您需要告诉plog-converter在结果报告中包括MISRA警告:
plog-converter -a MISRA:1,2,3 -m misra ....Under Windows, you can use the "C and C++ Compiler Monitoring UI" utility's settings:
在Windows下,可以使用“ C and C ++ Compiler Monitoring UI ”实用程序的设置:

See the "PVS-Studio: Support of MISRA C and MISRA C++ Coding Standards" article to learn more about MISRA support.
请参阅“ PVS-Studio:MISRA C和MISRA C ++编码标准的支持 ”一文,以了解有关MISRA支持的更多信息。
结论 (Conclusion)
In this article, we've briefly discussed the PVS-Studio analyzer's features for checking embedded-targeted projects. If you need more information on using the analyzer, I recommend that you refer to the following articles:
在本文中,我们简要讨论了PVS-Studio分析仪用于检查嵌入式目标项目的功能。 如果您需要有关使用分析仪的更多信息,建议您参考以下文章:
Getting acquainted with the PVS-Studio static code analyzer on Windows;
PVS-Studio SAST (Static Application Security Testing, SAST);
制止虚假警报 。
pvs-stdio ue4


 3496
3496


 被折叠的 条评论
为什么被折叠?
被折叠的 条评论
为什么被折叠?
 到【灌水乐园】发言


