


sql nolock
Sometimes people use nolock hint as a “turbo” button for their queries, assuming that not taking locks will speed up the query execution. There are many good articles describing all the dangerous moments of this approach, because of the read uncommitted isolation level. However, the focus of this article is a performance problem that you may encounter using nolock hint in some cases.
有时,人们假设nolock提示不用作锁定将加快查询的执行速度,因此将nolock提示用作其查询的“ turbo”按钮。 由于读取了未提交的隔离级别,因此有很多不错的文章描述了这种方法的所有危险时刻。 但是,本文的重点是在某些情况下使用nolock提示可能遇到的性能问题。
Let us setup some test data first.
让我们先设置一些测试数据。
I am using Microsoft SQL Server 2014 – 12.0.2342.0 (X64) for this article, but the problem may be also reproduced on the earlier versions, however, because of the small differences in the costing model heuristics, there might be another number of test rows.
我在本文中使用的是Microsoft SQL Server 2014 – 12.0.2342.0(X64),但该问题也可能在较早版本中重现,但是,由于成本模型启发式算法的细微差异,可能需要进行大量测试行。
测试数据 (Test Data)
We are creating the new DB and setting compatibility mode to 110 to force old cardinality estimation behavior. Then two simple tables t1 and t2 are created and filled up with 35 000 and 160 000 rows accordingly. Pay attention that the column t2.b is nullable.
我们正在创建新的数据库并将兼容模式设置为110,以强制执行旧的基数估计行为。 然后,创建两个简单表t1和t2 ,并相应地填充了35 000和160000行。 请注意,列t2.b可为空。
create database NoLockDB;
go
alter database NoLockDB set compatibility_level = 110;
go
use NoLockDB;
go
if object_id('t1') is not null drop table t1;
if object_id('t2') is not null drop table t2;
go
create table t1(a int primary key identity, b int, c char(350) not null default(''));
create table t2(a int primary key identity, b int, c char(50) not null default(''));
go
with c as (
	select top(35000) rn=row_number() over(order by(select null)) from master..spt_values v1,master..spt_values v2,master..spt_values v3
)
insert into t1(b)
select convert(varchar(10), rn) from c;

with c as (
	select top(160000) rn=row_number() over(order by(select null)) from master..spt_values v1,master..spt_values v2,master..spt_values v3
)
insert into t2(b)
select rn from c
go
dbcc freeproccache; -- clear cache.
go
问题 (Problem)
Now, let’s issue two identical queries, that check existence of t1.b values in t2.b column. I use MAXDOP query hint, to keep the plan shape simple, but the problem is also reproduced without DOP restriction in parallel plans.
现在,让我们发出两个相同的查询,以检查t2.b列中t1.b值的存在。 我使用MAXDOP查询提示来使计划形状保持简单,但是在并行计划中没有DOP限制的情况下也会重现该问题。
set statistics time, xml, io on;
select * from t1 where b not in (select b from t2) option(maxdop 1);
select * from t1 where b not in (select b from t2 with(nolock)) option(maxdop 1);
set statistics time, xml, io off;
go
Run them a couple of times to warm up cache, and observe the timing results.
运行它们几次以预热缓存,并观察计时结果。
CPU time = 281 ms, elapsed time = 428 ms.
CPU time = 11828 ms, elapsed time = 13070 ms.
CPU时间= 281毫秒,经过时间= 428毫秒。
CPU时间= 11828毫秒,经过的时间= 13070毫秒。
The second query is more than 30 times slower (on my machine).
第二个查询的速度比我的机器慢30倍以上。
The IO statistics is also interesting:
IO统计信息也很有趣:
Table ‘Workfile’. Scan count 0, logical reads 0, physical reads 0, read-ahead reads 0, lob logical reads 0, lob physical reads 0, lob read-ahead reads 0.
Table ‘Worktable’. Scan count 0, logical reads 0, physical reads 0, read-ahead reads 0, lob logical reads 0, lob physical reads 0, lob read-ahead reads 0.
Table ‘t2’. Scan count 3, logical reads 107680, physical reads 0, read-ahead reads 0, lob logical reads 0, lob physical reads 0, lob read-ahead reads 0.
Table ‘t1’. Scan count 1, logical reads 1598, physical reads 0, read-ahead reads 0, lob logical reads 0, lob physical reads 0, lob read-ahead reads 0.
Table ‘Workfile’. Scan count 0, logical reads 0, physical reads 0, read-ahead reads 0, lob logical reads 0, lob physical reads 0, lob read-ahead reads 0.
Table ‘Worktable’. Scan count 0, logical reads 0, physical reads 0, read-ahead reads 0, lob logical reads 0, lob physical reads 0, lob read-ahead reads 0.
Table ‘t2’. Scan count 3, logical reads 37678, physical reads 0, read-ahead reads 0, lob logical reads 0, lob physical reads 0, lob read-ahead reads 0.
Table ‘t1’. Scan count 1, logical reads 1598, physical reads 0, read-ahead reads 0, lob logical reads 0, lob physical reads 0, lob read-ahead reads 0.
表“工作文件”。 扫描计数0,逻辑读0,物理读0,预读0,lob逻辑读0,lob物理读0,lob预读0。
表“工作表”。 扫描计数0,逻辑读0,物理读0,预读0,lob逻辑读0,lob物理读0,lob预读0。
表“ t2”。 扫描计数3,逻辑读107680,物理读0,预读0,lob逻辑读0,lob物理读0,lob预读0。
表't1'。 扫描计数1,逻辑读1598,物理读0,预读0,lob逻辑读0,lob物理读0,lob预读0。
表“工作文件”。 扫描计数0,逻辑读0,物理读0,预读0,lob逻辑读0,lob物理读0,lob预读0。
表“工作表”。 扫描计数0,逻辑读0,物理读0,预读0,lob逻辑读0,lob物理读0,lob预读0。
表“ t2”。 扫描计数3,逻辑读37678,物理读0,预读0,lob逻辑读0,lob物理读0,lob预读0。
表't1'。 扫描计数1,逻辑读1598,物理读0,预读0,lob逻辑读0,lob物理读0,lob预读0。
The second slow query has 3 times less reads than the first, the fast one.
第二个慢查询的读取次数比第一个慢查询的少3倍。
If we look at the plans we will see that they are very similar and have the same cost of 12.7057 units.
如果我们看一下这些计划,我们会发现它们非常相似,并且成本为12.7057单位。
说明 (Explanation)
Experienced SQL user, even without looking at the query plan, may say, that writing a query using NOT IN clause, where nulls are possible in subquery is very dangerous and leads to mistakes, but now the question is: why the second execution is 30 times slower, though the plans seems identical. (We may invent another example where the difference would be 100x or more times slower).
有经验SQL用户,即使不看查询计划,可能会说,使用NOT IN子句编写查询(在子查询中可能为null)是非常危险的,并会导致错误,但是现在的问题是:为什么第二次执行是30时间慢了一点,尽管计划似乎完全一样。 (我们可以发明另一个例子,其中差异将慢100倍或更多倍)。
First, let’s look at the plan in general.
首先,让我们看一下总体计划。
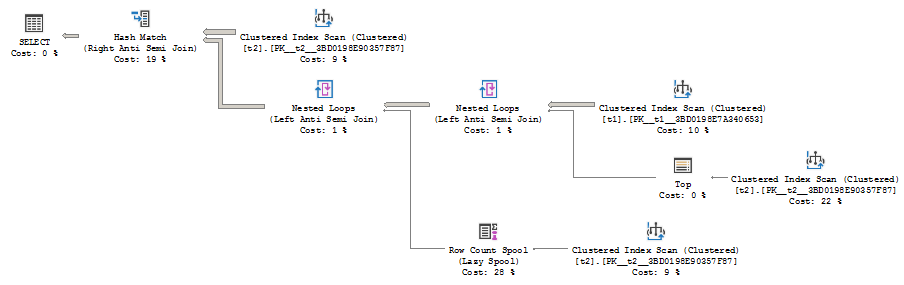
The plan is quite complex, for that simple query, and has four access operators (Clustered Index Scans), the Spool operator, the Top operator and three joins. The reason for this complex plan is that the Query Optimizer (QO) should build a plan with concern, that no rows should be returned if at least one NULL value is encountered in t2.b column.
对于该简单查询,该计划非常复杂,并且具有四个访问运算符(集群索引扫描),假脱机运算符,顶级运算符和三个联接。 制定此复杂计划的原因是,查询优化器(QO)应该构建一个值得关注的计划,如果t2.b列中至少遇到一个NULL值,则不应该返回任何行。
With that semantic goal, the QO uses various optimization techniques. One of those optimizations is to use a Top operator. The Top operator is not necessary for the result correctness in this case, because we have Left Anti Semi Join as a logical join operation (Anti Semi join is not an Inner or Outer join, it only checks for not existence and does not need a complete join result). However the optimizer may still benefit from the Top to avoid the full scan of the second table.
出于这个语义目标,QO使用了各种优化技术。 这些优化之一是使用Top运算符。 在这种情况下,Top运算符对于结果正确性不是必需的,因为我们将Left Anti Semi Join作为逻辑联接操作(Anti Semi联接不是内部联接或外部联接,它仅检查不存在并且不需要完整的联接。加入结果)。 但是,优化器可能仍然会从顶部受益,从而避免对第二张表进行全面扫描。
Now a few words about the NOLOCK hint. A long time ago, there was a great article in SQL Server Storage Engine Blog about two scanning techniques: Index Order Scan and Allocation/IAM order scan. The point is that if the QO does not demand rows in any specific order the Storage Engine may choose, whether to scan the index in the index page order or use Index Allocation Maps (IAM) pages to scan index in the allocation order. However, the allocation order scan is more vulnerable to inconsistency errors and server chooses it only if no such errors are possible (e.g. the table is locked with tablock hint) or we don’t care about these errors (e.g. nolock hint – this is our case). Unfortunately, we cannot distinct those two types of scan from the query plan, but this is the key difference between these to query executions.
现在来谈谈NOLOCK提示。 很久以前,SQL Server Storage Engine博客上有一篇很棒的文章介绍了两种扫描技术:索引顺序扫描和分配/ IAM顺序扫描。 关键是,如果QO不要求存储引擎选择任何特定顺序的行,是按索引页顺序扫描索引还是使用索引分配图(IAM)页按分配顺序扫描索引。 但是,分配顺序扫描更容易受到不一致错误的影响,服务器仅在不可能发生此类错误(例如,表已用tablock提示锁定)或我们不关心这些错误(例如,nolock提示)时才选择它。案件)。 不幸的是,我们无法从查询计划中区分这两种类型的扫描,但这是这两种查询执行之间的主要区别。
One interesting thing about an allocation order scan is that it has an extra startup cost. It enumerates every leaf page that it is going to scan every time the scan is performed. The reason for that, according to the documentation, might be the following:
关于分配顺序扫描的一件有趣的事情是,它具有额外的启动成本。 枚举每次执行扫描时将扫描的每个叶子页。 根据文档 ,其原因可能如下:
When we don’t use a nolock hint, SQL Server uses an index order scan that has not as much startup cost as an allocation order scan has. The Top operator prevents scanning the whole table every time. When a nolock hint is used a server decides to use allocation order scan. Considering the scan operator is located on the inner side if the nested loops join we get the initial startup cost penalty for every execution of the inner side of the join. This lead to multiple function calls inside SQL Server and high CPU consumption.
当我们不使用nolock提示时,SQL Server使用的索引顺序扫描的启动成本不及分配顺序扫描的启动成本。 顶级运算符可防止每次扫描整个表。 当使用nolock提示时,服务器决定使用分配顺序扫描。 考虑到如果嵌套循环联接,扫描运算符位于内侧,则对于联接的内侧的每次执行,我们都会获得初始启动成本损失。 这会导致在SQL Server内部进行多个函数调用,并且会占用大量CPU。
To put it all together – I tried to draw a simple picture to illustrate the conception.
综上所述–我试图画一张简单的图片来说明这一概念。
Consider the following call stack (from WinDbg converted to XML):
考虑以下调用堆栈(从WinDbg转换为XML):
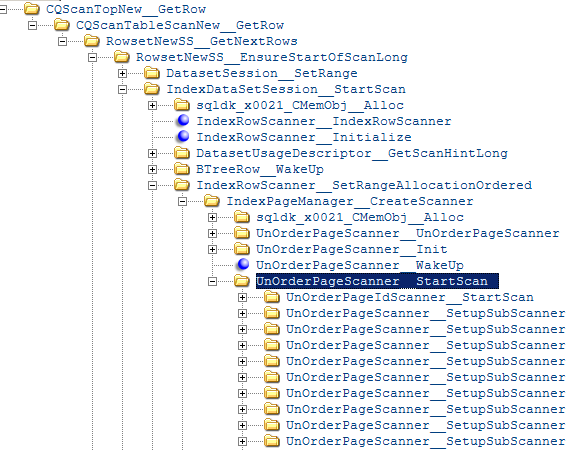
And each scanner calls the following methods:
每个扫描仪都调用以下方法:
And this is done for every single loop iteration.
这是针对每个单循环迭代完成的。
If we attach a debugger we can compare the number of instruction per execution:
如果我们连接调试器,我们可以比较每次执行的指令数:
Index Order Scan: 22 516 function calls per execution
Allocation Scan: 641 340 function calls per execution
索引顺序扫描:每次执行22 516个函数调用
分配扫描:每次执行641340个函数调用
This explains high CPU time, that we may see in the statistics time output.
这说明了CPU时间过长,我们可能会在统计时间输出中看到这一点。
We may also do simple rough calculations of the IO reads:
我们还可以对IO读数进行简单的粗略计算:
Reads = 1334(t2 scan) + 1334(t2 scan under spool) + 35000(exec count of t2 scan on the loop join inner side)*3 (t2 index depth)*1(approximately one page per execution) = 107668 reads – roughly corresponds with 107680 actual reads
读取= 1334(t2扫描)+ 1334(s2下的t2扫描)+ 35000(循环连接内侧t2扫描的执行计数) * 3(t2索引深度) * 1(每次执行约一页)= 107668读取–大致对应107680个实际读数
Reads = 1334(t2 scan) + 1334(t2 scan under spool) + 35000(exec count of t2 scan on the loop join inner side)*1(approximately one page per execution) = 37668 reads – roughly corresponds with 37678 actual reads
读取= 1334(t2扫描)+ 1334(在假脱机下的t2扫描)+ 35000(在循环连接内侧对t2扫描的执行计数)* 1(每次执行大约一页)= 37668读取–大致对应于37678的实际读取
It seems odd at first glance that the query that has less reads executes much longer, but now it is clear, I hope. The difference is what types of pages (Root or IAM) are used to get the first leaf page and how those page reads are counted in the statistics output.
乍看之下,读取次数较少的查询执行的时间更长,这似乎很奇怪,但是我希望现在已经很清楚了。 区别在于使用哪种类型的页面(Root或IAM)来获取第一个叶子页面,以及如何在统计信息输出中计算这些页面的读取次数。
如何避免这个问题 (How to avoid the problem)
Using NOT IN with nullable column is like a timing bomb. Even if now everything seems fine, as soon as one NULL values will appear in subquery, no rows at all will be produced. Usually, it is undesired behavior.
对可为空的列使用NOT IN就像定时炸弹。 即使现在看起来一切正常,只要在子查询中出现一个NULL值,就不会产生任何行。 通常,这是不希望的行为。
If we rewrite our query in a more safe way, like:
如果我们以更安全的方式重写查询,例如:
set statistics time, xml, io on;
select * from t1 where not exists (select b from t2 where t2.b = t1.b) option(maxdop 1);
select * from t1 where not exists (select b from t2 with(nolock) where t2.b = t1.b) option(maxdop 1);
set statistics time, xml, io off;
go
CPU time = 109 ms, elapsed time = 112 ms.
CPU time = 110 ms, elapsed time = 165 ms.
CPU时间= 109毫秒,经过时间= 112毫秒。
CPU时间= 110毫秒,经过的时间= 165毫秒。
The problem is gone, both queries are fast and the plan shape is much simpler.
问题消失了,两个查询都很快,计划的形状也简单得多。
With this rewrite, we changed the semantics of the query and now the Query Optimizer has no need to be concerned with null values in subquery.
通过这种重写,我们更改了查询的语义,现在查询优化器不再需要关注子查询中的空值。
Another good thing is to define a column as not nullable if no nulls are possible there. The optimizer may use that information while building a plan.
另一件事是将一个列定义为不可为空,如果那里没有空值的话。 优化器可以在制定计划时使用该信息。
The last piece of advice, would be of course, do not use the nolock hint as a “turbo” button, unless you realize all the consequences.
最后一条建议当然是不要将nolock提示用作“ turbo”按钮,除非您意识到所有后果。
参考资料 (References)
- Managing Space Used by Objects 管理对象使用的空间
- Reading Pages 阅读页面
- SQL Server Performance Tuning: Data Access Method SQL Server性能调优:数据访问方法
- When can allocation order scans be used? 什么时候可以使用分配顺序扫描?
看更多 (See more)
To view and analyze SQL Server query execution plans for free, check out ApexSQL Plan
要免费查看和分析SQL Server查询执行计划,请查看ApexSQL Plan
sql nolock


 2976
2976

 被折叠的 条评论
为什么被折叠?
被折叠的 条评论
为什么被折叠?
 到【灌水乐园】发言


