


In this article, we are going to learn how to use Power BI Desktop Q&A functionality to enable users to ask the question from the data set and easily get the results without any configuration or write complex codes.
在本文中,我们将学习如何使用Power BI Desktop问答功能使用户能够从数据集中提出问题,并且无需任何配置或编写复杂代码即可轻松获得结果。
In today’s digital world, we are moving towards more interactions with the data with natural language. You might be familiar with the Amazon’s Alexa Microsoft Cortana or the Apple’s Siri. Natural language helps the users to communicate with our data set in a friendly way. If we can implement the interactions using natural language in the business intelligence system, it would be convenient to deal with complex data. We do not need to write complex queries, create visualization every time as per the user’s requirements.
在当今的数字世界中,我们正在朝着与自然语言的数据进行更多交互的方向发展。 您可能熟悉亚马逊的Alexa Microsoft Cortana或苹果的Siri。 自然语言可以帮助用户以友好的方式与我们的数据集进行交流。 如果我们可以在商务智能系统中使用自然语言来实现交互,那么处理复杂数据将很方便。 我们不需要编写复杂的查询,也不需要每次都根据用户要求创建可视化。
In Power BI Desktop, we can talk with the data using the Q & A feature. We can ask questions and get the data, visualizations with this natural language. When we ask questions using the Q & A functionality in natural language, Power BI creates the data or visualizations based on the keywords. It generates the visualization as per the keywords. This is a very quick process and we get the result very fast. We should create the data set and its columns with functional meaning. It would be easy for the users to understand the data set and ask the questions effectively. We need to understand the difference between the search engine and the Q&A functionality. In a search engine, we search data across the web but Q& A gives results from the data set used in the Power BI Desktop report.
在Power BI Desktop中,我们可以使用“问答”功能与数据对话。 我们可以用这种自然语言提出问题并获得数据和可视化效果。 当我们使用自然语言的“问与答”功能提问时,Power BI会基于关键字创建数据或可视化。 它根据关键字生成可视化。 这是一个非常快的过程,我们可以很快得到结果。 我们应该创建具有功能含义的数据集及其列。 用户很容易理解数据集并有效地提出问题。 我们需要了解搜索引擎和问答功能之间的区别。 在搜索引擎中,我们在整个网络上搜索数据,但“问答”给出了Power BI Desktop报告中使用的数据集的结果。
In Power BI, Q&A currently works only if the data model is having the imported data. If we are using the live connections to SQL Server Analysis Service (Cube) or direct query to data, we cannot use the Q&A.
在Power BI中,仅当数据模型具有导入的数据时,Q&A当前有效。 如果我们使用到SQL Server Analysis Service(多维数据集)的实时连接或对数据的直接查询,则不能使用“问答”。
Power BI currently supports asking natural language questions in English. Let us explore this functionality in a practical way.
Power BI当前支持用英语询问自然语言问题。 让我们以实用的方式探索此功能。
In this example, we will use the sample dashboard available at the Microsoft docs. We will use Q& A functionality in the Power BI Desktop, therefore, download the .pbix file from the link mentioned above.
在此示例中,我们将使用Microsoft docs上提供的示例仪表板。 我们将在Power BI桌面中使用问答功能,因此,请从上述链接下载.pbix文件。
Let me give a brief introduction to the sample data used in the report. This sample contains a sales and marketing dashboard for the manufacturing company. It contains multiple dashboards to visualize the company market share, sentiments, and Growth Opportunities.
让我简要介绍一下报告中使用的示例数据。 此样本包含制造公司的销售和营销仪表板。 它包含多个仪表板,以可视化公司的市场份额,情绪和增长机会。
Below is the screenshot from the visual.
下面是视觉截图。
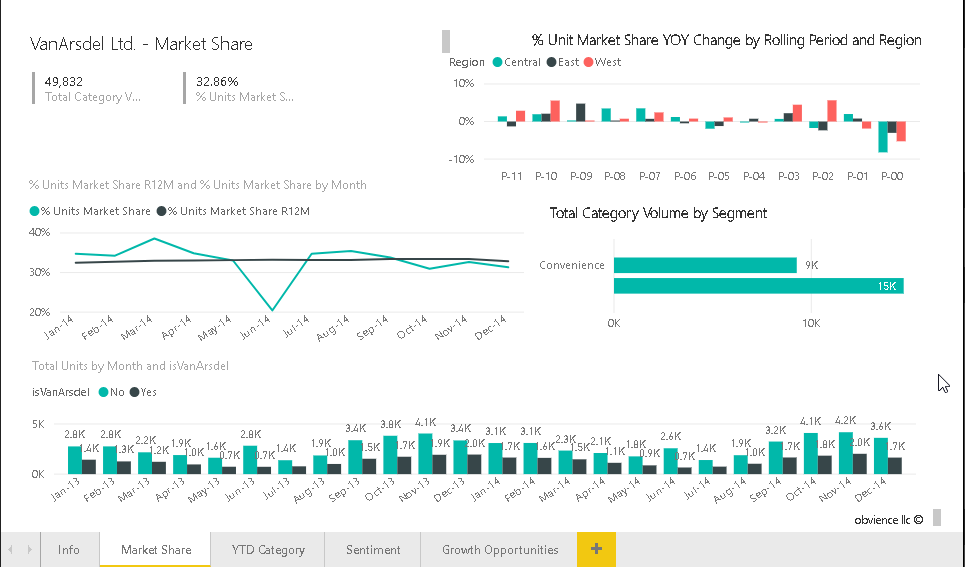
In this report, you can see we have the following charts
在此报告中,您可以看到我们有以下图表
- Market share 市场份额
- % Unit Market Share YOY Change by Rolling Period and Region 滚动时间段和地区的单位市场份额百分比同比变化
- % Unit Market share R12M and % units Market Share by Month %单位市场份额R12M和%单位市场份额(按月)
- Total category Volume by segment 分类总类别
- Total Units by Month 月总数
In the Power BI Desktop menu bar, you can see the icon ‘Ask a Question’.
在Power BI Desktop菜单栏中,您可以看到“问问题”图标。
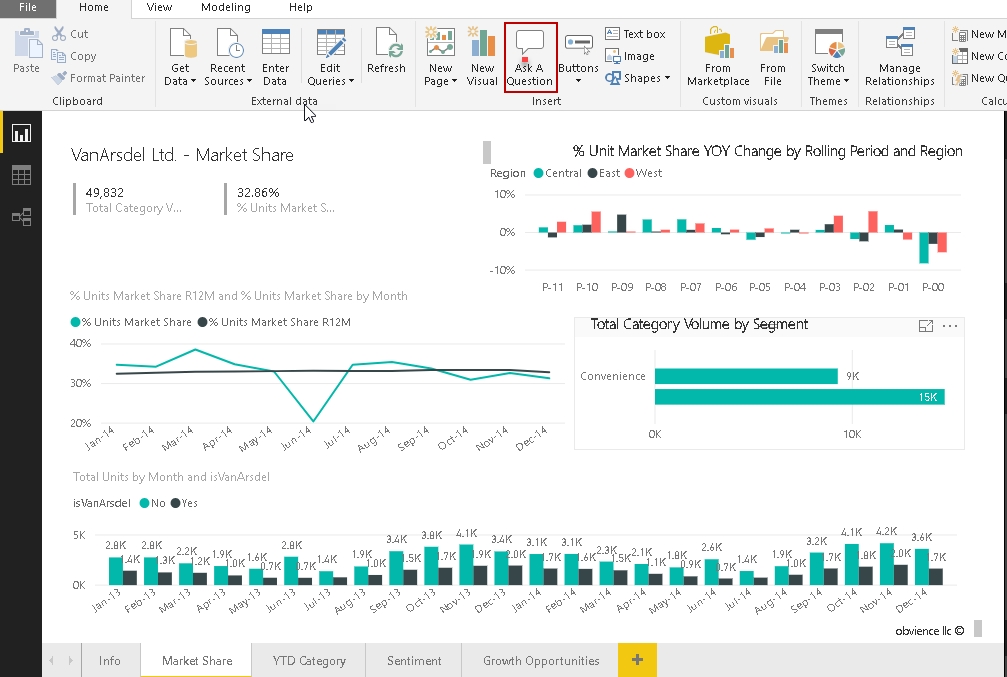
Click on this icon and it launches the Q&A pop up box in the report.
单击此图标,它将启动报告中的“问答”弹出框。
It also launches a window where it would display data or create visualizations. Adjust the size of this window and make some room in the report to display data properly.
它还会启动一个窗口,在其中显示数据或创建可视化效果。 调整此窗口的大小,并在报表中留出一些空间以正确显示数据。
Let us start interaction with our data in natural language. When we start typing in the text box, it gives suggestion inline as well. In below example, you can see that once we type total units, we get a suggestion to get results by product, by date or by Geo.
让我们开始以自然语言与我们的数据进行交互。 当我们开始在文本框中键入内容时,它也会内嵌建议。 在下面的示例中,您可以看到输入总单位后,我们会建议您按产品,日期或地理位置来获取结果。
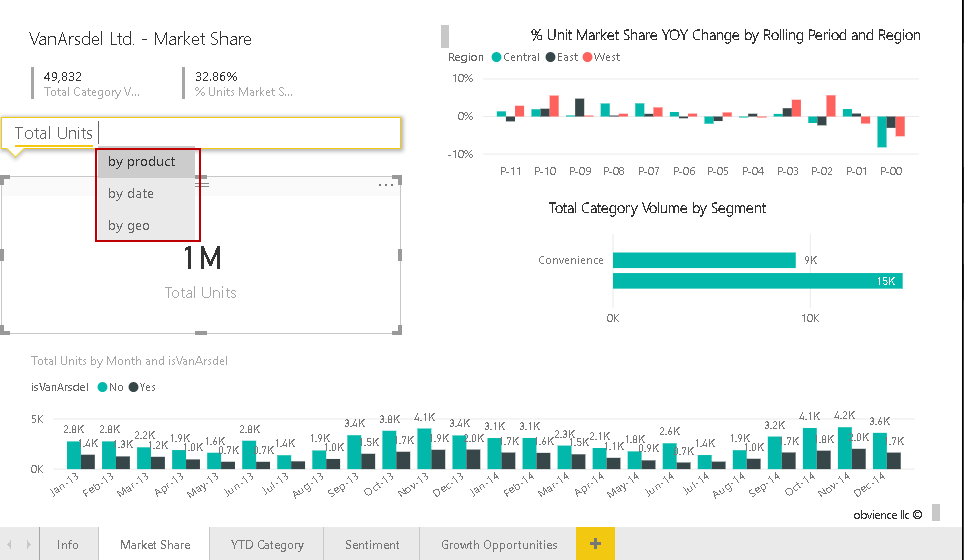
Let us enter in Q&A box ‘Total Units by product’ and we get the desired data output as shown here.
让我们在“问与答”框中输入“问答总数”,我们将获得所需的数据输出,如下所示。
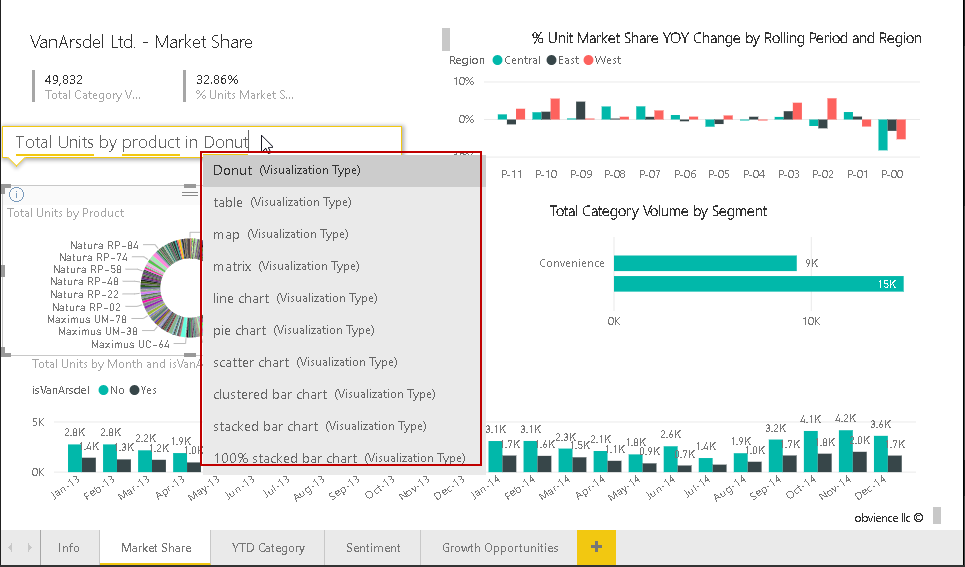
Now, change the question to represent this data into visualization form. In below screenshot, we want to represent data in Donut form. Once we type Donut, it identifies it and displays the visualization suggestions. However, it might not generate the visualization properly due to the data set.
现在,更改问题以将该数据表示为可视化形式。 在下面的屏幕截图中,我们想以Donut形式表示数据。 键入Donut后,它将对其进行识别并显示可视化建议。 但是,由于数据集的原因,它可能无法正确生成可视化效果。
Now, we will again ask the question to Power BI data set.
现在,我们将再次向Power BI数据集提问。
Question: total units by manufacturer and category in a treemap chart
问题:树状图中按制造商和类别划分的总单位
Question: show unit by year and the category, product
问题:按年份和类别,产品显示单位
In the examples above, we saw that Q&A functionality gives an automated suggestion as per the column and the tables defined. Power BI Desktop Q& A is very smart language processing system.
在上面的示例中,我们看到Q&A功能根据定义的列和表格给出了自动建议。 Power BI Desktop问答是一种非常智能的语言处理系统。
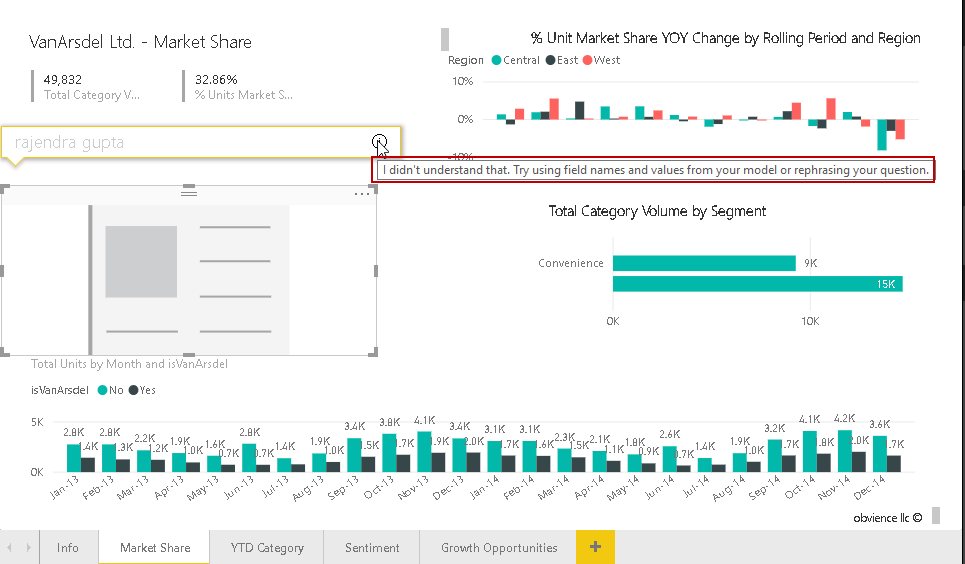
If you enter the text or question that Power BI does not understand, it gives the message accordingly. For example, just for testing purpose, I put my name into the Q&A box. It gives the error message ‘I didn’t understand that. Try using field names and values from your model or rephrasing your question’.
如果输入Power BI无法理解的文本或问题,则会相应地显示该消息。 例如,仅出于测试目的,我将我的名字放入“问答”框中。 它给出了错误消息“我听不懂。 尝试使用模型中的字段名称和值,或改写您的问题”。
You can ask any question from the data set. Let me ask a question again to get the data of ‘show products sorted by the manufacturer’.
您可以从数据集中提出任何问题。 让我再次问一个问题,以获取“按制造商分类的显示产品”的数据。
Until now, Q&A in Power BI Desktop allows interacting with the data with natural language and we do not have to do customization in order to get our results in multiple format or visuals.
到目前为止,Power BI Desktop中的Q&A允许使用自然语言与数据进行交互,并且我们不必进行自定义即可获得多种格式或视觉效果的结果。
考虑在Power BI中使用问答 (Consideration to use Q&A in Power BI)
As stated earlier, we use natural language to interact with the data in Power BI. When we ask any questions in Q&A, Power BI looks out for the keywords and makes assumptions about the data model. We should prepare our data set so that it can use this Q&A functionality. We should take a few considerations while preparing the data set.
如前所述,我们使用自然语言与Power BI中的数据进行交互。 当我们在问答环节中提出任何问题时,Power BI会寻找关键字并进行数据模型假设。 我们应该准备我们的数据集,以便它可以使用此Q&A功能。 在准备数据集时,我们应该考虑一些注意事项。
- Data Relationship: we should establish the relationships between tables so that Q&A can join these tables and prepare the output. In our example above, if we do not have any relationship between the Manufacturer and the Product table, Q&A cannot join these tables.数据关系:我们应该建立表之间的关系,以便Q&A可以联接这些表并准备输出。 在上面的示例中,如果“制造商”表与“产品”表之间没有任何关系,则“问答”无法加入这些表。
Therefore, we cannot ask the questions like Show products order by manufacturer
因此,我们不能提出诸如按制造商显示产品订单之类的问题
We should have the relationship between tables like below to get an answer to questions like Show products order by manufacturer.
我们应该在下表之间建立关系,以回答诸如“按制造商显示产品订单”之类的问题。
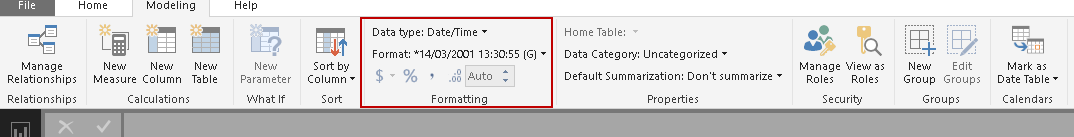
- Data Types: We should have the proper data type for the imported data. Sometimes when we import data from various sources, it might not capture the correct data type. For example, date/time is referred to as string as well. If we define string on the date\time column, we will not get the proper output using Q&A. Q&A cannot interpret the string data in that scenario数据类型:对于导入的数据,我们应该具有正确的数据类型。 有时,当我们从各种来源导入数据时,它可能无法捕获正确的数据类型。 例如,日期/时间也称为字符串。 如果在date \ time列上定义字符串,则使用Q&A将不会获得正确的输出。 在这种情况下,Q&A无法解释字符串数据
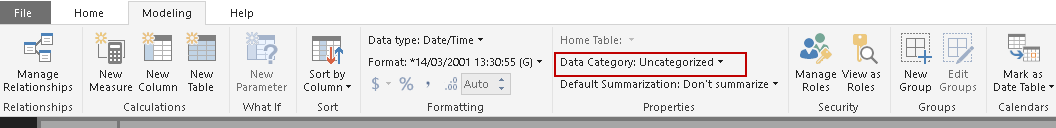
- Data Category: We can define the data category to provide additional information for the Q&A. This data category will help Q&A to evaluate the data set information and provide the result set数据类别:我们可以定义数据类别以提供有关问答的其他信息。 该数据类别将有助于问答,以评估数据集信息并提供结果集
For example, a column might have information about the address, country, place, latitude, longitude, place, postal code etc. 例如,一列可能包含有关地址,国家/地区,地点,纬度,经度,地点,邮政编码等信息。Q&A will use the data classification information to visualize the data.
Q&A将使用数据分类信息来可视化数据。
- Normalize the data: In Q&A, it better to normalize the data. We might have all the information in a single table. In our example above, below are the normalized tables and their relationships together. It is the best practice to normalize the data into multiple tables with meaningful column names. It will help to Q&A to take the decision to visualize and prepare the data in the backend标准化数据:在“问答”中,最好标准化数据。 我们可能会将所有信息都放在一个表中。 在上面的示例中,下面是标准化表及其之间的关系。 最佳做法是将数据标准化为具有有意义列名的多个表。 这将有助于Q&A做出可视化并准备后端数据的决定
- Pivot tables: We should structure data to have a single column for each kind of data. Consider the below table. In this table, we have the table that contains the row having s a different property of the order. It would be difficult for Q&A to produce the result from this kind of table. If we ask question ‘show salesperson order by territory’, Q&A cannot produce the results because each column does not have similar kind of data
This table format should be like below. In this table, each column represents similar kind of data.
- 数据透视表:我们应该将数据结构化为每种数据都具有单个列。 考虑下表。 在此表中,我们具有包含该行的表,该行具有不同的订单属性。 Q&A很难从这种表格中得出结果。 如果我们问“按地区显示销售人员的订单”问题,则问答无法产生结果,因为每一列都没有类似的数据
该表格格式应如下所示。 在此表中,每一列代表相似的数据。
结论 (Conclusion)
Q&A functionality in Power BI Desktop enables users to ask the question from the data set and easily get the results without any configuration or write complex codes. We can create visuals as well just by asking the questions. It gives the suggestions as well once we start typing the questions in Q&A box. I really found it a very useful tool to use natural language interaction with the data. You can explore this feature in your environment.
Power BI Desktop中的问答功能使用户可以从数据集中提出问题,并轻松获得结果,而无需进行任何配置或编写复杂的代码。 我们也可以通过提出问题来创建视觉效果。 一旦我们开始在“问答”框中键入问题,它也会提供建议。 我真的发现它是将自然语言与数据进行交互的非常有用的工具。 您可以在您的环境中探索此功能。
目录 (Table of contents)
翻译自: https://www.sqlshack.com/ask-a-question-feature-in-power-bi-desktop/


 1640
1640


 被折叠的 条评论
为什么被折叠?
被折叠的 条评论
为什么被折叠?
 到【灌水乐园】发言


