


sql server死锁
介绍 (Introduction)
In the previous article entitled “What are SQL Server deadlocks and how to monitor them“, we’ve seen how a deadlock can occur and which tools are available to DBA or developer to get simple or extended information about the conditions that lead a particular deadlock situation to occur.
在上一篇名为“ 什么是SQL Server死锁以及如何监视死锁 ”的文章中,我们已经看到了死锁是如何发生的,以及DBA或开发人员可以使用哪些工具来获取有关导致特定死锁的条件的简单或扩展信息。情况发生。
Now, we will need to use collected data in order to build a graph with deadlock occurrences over time. After a little word about a check that should be done before investing time into deadlock data collection, this article will present two different approaches to plot a diagram with deadlock occurrences over time. The first one will use SQL Server Error Logs while the second one will take advantage of SQL Server Extended Events.
现在,我们将需要使用收集的数据来构建一个随着时间推移发生死锁的图形。 在花费一些时间进行死锁数据收集之前应该做的检查后,本文将介绍两种不同的方法来绘制随着时间推移发生死锁的图表。 第一个将使用SQL Server错误日志,而第二个将利用SQL Server扩展事件。
初步检查 (The initial check)
In my opinion, logging and reporting must be used wisely. So, I prefer to take gradual information about deadlocks. With that in mind, it’s a good idea to get an overview on how often they happen. That’s the subject of this section.
我认为,必须明智地使用日志记录和报告。 因此,我倾向于逐步了解有关死锁的信息。 考虑到这一点,最好对它们发生的频率进行概述。 这是本节的主题。
We could run following query to get how many deadlocks happened since startup, when startup occurred and how many deadlocks per day (on average). In order to get startup date, we will use the creation date value of [tempdb] database as this database is recreated at startup of SQL Server. This query can be customized to keep the value of ‘Number of Deadlocks/sec’ performance counter over time.
我们可以运行以下查询以获取自启动以来发生了多少死锁,启动发生的时间以及每天(平均)有多少死锁。 为了获得启动日期,我们将使用[tempdb]数据库的创建日期值,因为该数据库是在SQL Server启动时重新创建的。 可以自定义此查询,以随时间保持“死锁数/秒”性能计数器的值。
SELECT
    'Deadlocks Occurrences Report',
    CONVERT(BIGINT,((1.0 * p.cntr_value /
NULLIF(datediff(DD,d.create_date,CURRENT_TIMESTAMP),0)))) as
AveragePerDay,
    CAST(p.cntr_value AS NVARCHAR(100)) + ' deadlocks have been recorded
since startup.' AS Details,
    d.create_date as StartupDateTime
FROM sys.dm_os_performance_counters p
INNER JOIN sys.databases d ON d.name = 'tempdb'
WHERE RTRIM(p.counter_name) = 'Number of Deadlocks/sec'
AND RTRIM(p.instance_name) = '_Total'
;
Here is a sample output for former query:
这是以前查询的示例输出:
I would not recommend investing time on solving deadlock problems when we don’t have at least 10 deadlocks happening a day. But I would also recommend checking the value of StartupDateTime column value because if this value is over a year, then the value of the AveragePerDay column could be very skewed and further investigations should be done. Alternately, if it’s possible, you could restart SQL Server.
当我们每天至少发生10个死锁时,我不建议您花时间解决死锁问题。 但是我也建议您检查StartupDateTime列值的值,因为如果该值超过一年,那么AveragePerDay列的值可能会非常不正确,因此应做进一步的调查。 或者,如果可能,您可以重新启动SQL Server。
SQL Server错误日志中的死锁发生图 (Deadlock occurrences diagrams from a SQL Server Error Log)
If we find deadlocks happening daily, we might want to see when they happen with more accuracy. Actually, we could extract this information from the SQL Server Error Log.
如果我们发现僵局每天都在发生,我们可能希望更准确地了解何时发生僵局。 实际上,我们可以从SQL Server错误日志中提取此信息。
In the previous article, we’ve seen that there is a thread called “Deadlock monitor” which generates a 1205 error. We also saw that following statement will tell SQL Server to write an entry in its Error Log every time a 1205 error is raised:
在上一篇文章中 ,我们已经看到有一个名为“ Deadlock monitor”的线程,该线程会产生1205错误。 我们还看到,每次出现1205错误时,以下语句将告诉SQL Server在其错误日志中写入一个条目:
EXEC sp_altermessage 1205, 'WITH_LOG', 'true'
We can count on a stored procedure called xp_readerrorlog to read from Error log and get back any record related to 1205 error.
我们可以依靠一个名为xp_readerrorlog的存储过程从错误日志中读取并获取与1205错误相关的任何记录。
You will find attached to this article a stored procedure called Reporting.DeadlockTimeLine that will take care of extracting these occurrences from the SQL Server Error Log.
您将在本文附件中找到一个名为Reporting.DeadlockTimeLine的存储过程,该过程将负责从SQL Server错误日志中提取这些事件。
Let’s look at the way this procedure is designed. First of all, let’s review its parameters.
让我们看看该过程的设计方式。 首先,让我们回顾一下它的参数。
ALTER PROCEDURE [Reporting].[DeadlockTimeLine](
    @OnlyCurrentLog		                  BIT         = 0,
    @ErrorLogID			            INT         = NULL,
    @StartDatePivot		                  DATETIME    = NULL,
    @EndDatePivot		                  DATETIME    = NULL,
    @TargetDatabaseName4OccurrencesReport   SYSNAME     = NULL,
    @TargetSchemaName4OccurrencesReport     SYSNAME     = NULL,
    @TargetTableName4OccurrencesReport      SYSNAME     = NULL,
    @AppendMode4OccurrencesReport           BIT         = 0,
    @TargetDatabaseName4HourlyReport        SYSNAME     = NULL,
    @TargetSchemaName4HourlyReport          SYSNAME     = NULL,
    @TargetTableName4HourlyReport           SYSNAME     = NULL,
    @AppendMode4HourlyReport                BIT         = 0,
    @TargetDatabaseName4DailyReport         SYSNAME     = NULL,
    @TargetSchemaName4DailyReport           SYSNAME     = NULL,
    @TargetTableName4DailyReport            SYSNAME     = NULL,
    @AppendMode4DailyReport                 BIT         = 0,
    @Debug                                  BIT         = 1
)
Its first two parameters are related to error log management. We can tell the stored procedure to extract only from current log or for a given error log file. Actually, the number of error log is configurable. We can also force SQL Server to create a new one using sp_cycle_errorlog stored procedure.
它的前两个参数与错误日志管理有关。 我们可以告诉存储过程仅从当前日志或给定的错误日志文件中提取。 实际上,错误日志的数量是可配置的 。 我们还可以强制SQL Server使用sp_cycle_errorlog存储过程创建一个新的存储过程。
After that, we have two parameters to define a time interval. Even though DateTime data type has limitations, this data type has been kept for compatibility with older systems. There are four possibilities for these parameters:
之后,我们有两个参数来定义时间间隔。 即使DateTime数据类型有局限性 ,仍保留此数据类型是为了与旧系统兼容。 这些参数有四种可能性:
| @StartDatePivot | @EndDatePivot | Resulting Interval |
| NULL | NULL | Take every occurrences as no interval is provided |
| NULL | With Value | All occurrences until EndDate |
| WithValue | NULL | All occurrences since StartDate |
| WithValue | With Value | All occurrences between StartDate and EndDate |
| @StartDatePivot | @EndDatePivot | 结果间隔 |
| 空值 | 空值 | 由于没有提供间隔,请考虑所有情况 |
| 空值 | 有价值 | 直到EndDate的所有事件 |
| 有价值 | 空值 | 自StartDate以来的所有事件 |
| 有价值 | 有价值 | StartDate和EndDate之间的所有匹配项 |
Then, there are a few sets of parameters that will tell the stored procedure to store computed results to tables. We must provide a target database name, schema name and table name for one or more of following situations:
然后,有几组参数将告诉存储过程将计算结果存储到表中。 对于以下一种或多种情况,我们必须提供目标数据库名称,架构名称和表名称:
- Occurrences by seconds, simply referred to as « Occurrences » 以秒为单位的发生次数,简称为“发生次数”
- Occurrences by hours, referred to as « Hourly » 每小时发生的次数,称为“每小时”
- Occurrences by days, referred to as « Daily » 每天发生的次数,称为“每日”
To do so, we must provide @Target[Database|Schema|Table]Name4[SituationName]Report parameters where SituationName can be either Occurrences, Daily or Monthly. If Database name or Schema name is omitted, it will set it to the value returned by respectively DB_NAME() and SCHEMA_NAME() built-in functions.
为此,我们必须提供@Target [Database | Schema | Table] Name4 [SituationName] Report参数,其中“情境名称”可以是“每日”或“每月”。 如果省略了数据库名称或模式名称,则将其设置为分别由内置函数DB_NAME()和SCHEMA_NAME()返回的值。
In addition, there are @AppendMode[SituationName]Report flags to tell the stored procedure whether to truncate target table before inserting records into it or not.
此外,还有@AppendMode [SituationName] Report标志,用于告知存储过程是否在将记录插入目标表之前截断目标表。
Finally, there is a @Debug flag to tell stored procedure whether to become talkative or not during its execution.
最后,有一个@Debug标志告诉存储过程在执行过程中是否变得健谈。
Its execution summary is pretty straight forward:
它的执行摘要非常简单:
To get the list of available SQL Server Error Logs, this procedure calls xp_enumerrorlogs stored procedure and stores its results in a temporary table. A similar processing is performed to read entries in each error log using xp_readerrorlog stored procedure. These are the noticeable aspects of this stored procedure. The code, itself, is pretty trivial.
若要获取可用SQL Server错误日志列表,此过程将调用xp_enumerrorlogs存储过程并将其结果存储在临时表中。 使用xp_readerrorlog存储过程执行类似的处理以读取每个错误日志中的条目。 这些是此存储过程中值得注意的方面。 代码本身非常简单。
The stored procedure source code contains some example usages. Here is one that I generally use to get a report on deadlock occurrences by hours in a timed interval. This helped me to explain to a supplier that performance issues were (obviously) linked to user activity and that there were a lot of deadlocks in an hour.
存储过程的源代码包含一些用法示例。 我通常使用它来按时间间隔按小时获取有关死锁事件的报告。 这有助于我向供应商解释,性能问题(显然)与用户活动有关,并且一小时内有很多僵局。
EXEC [DBA].[Reporting].[DeadlockTimeLine]
    @TargetDatabaseName4HourlyReport = 'DBA',
    @TargetSchemaName4HourlyReport   = 'dbo',
    @TargetTableName4HourlyReport    = 'DeadlockHourlyReport',
    @TargetDatabaseName4DailyReport  = 'DBA',
    @TargetSchemaName4DailyReport    = 'dbo',
    @TargetTableName4DailyReport     = 'DeadlockDailyReport',
    @StartDatePivot                  = '2017-02-10 00:00:00.000',
    @EndDatePivot                    = '2017-03-20 12:00:00.000'
;
Note
注意
We could automate table population with a SQL Server Agent Job or equivalent with @AppendMode* variables set to 1 and dynamic determination of @StartDatePivot and @EndDatePivot values.
我们可以使用SQL Server代理作业或将@ AppendMode *变量设置为1的等效项以及@StartDatePivot和@EndDatePivot值的动态确定来自动化表填充。
Whether we stored results in tables or we get a result set, we can’t use these data directly to generate a histogram. As you will see below, there are holes in date and times.
无论是将结果存储在表中还是获得结果集,我们都不能直接使用这些数据来生成直方图。 您将在下面看到,日期和时间存在漏洞。
To fill these holes, we will take advantage of with some « tally » tables. To do so, we will use:
为了填补这些漏洞,我们将利用一些“理货”表来加以利用。 为此,我们将使用:
A calendar table called Common.TallyCalendar that is similar to the one created by Ed Pollack in his article series about calendar table.
一个名为Common.TallyCalendar的日历表,类似于Ed Pollack在其有关日历表的文章系列中创建的日历表。
Here is a sample content of that table:
这是该表的示例内容:
- T-SQL as an asset to set-based programming approach » to learn how to build such a table (part 5.1 « Generate all seconds in a day »). T-SQL作为基于集合的编程方法的资产”,以学习如何构建这样的表(第5.1节“每天生成所有秒数”)。
Here is a sample of its content:
这是其内容的样本:
We will use common tabular expression in conjunction with these tables to get a suitable reporting data and be able to generate a pretty report that we can share.
我们将结合这些表格使用通用表格表达式 ,以获取合适的报告数据,并能够生成可共享的漂亮报告。
We will actually only get from the first table records that sit into our time interval, join them to the subset of the second table as we want to report by hour. This will generate all the lines for X axis and we can finally join with hour report table.
实际上,我们只从时间间隔内的第一个表记录中获取数据,然后将它们加入到第二个表的子集中,以便按小时报告。 这将生成X轴的所有行,我们最终可以加入小时报告表。
And this gives us this kind of query:
这给了我们这种查询:
DECLARE @StartDatePivot DATETIME = '2017-02-10' ;
DECLARE @EndDatePivot   DATETIME = '2017-03-20' ;

with Dates
AS (
    select
        CalendarDate,CONVERT(CHAR(4),CalendarYear)
        + RIGHT('0000' + CONVERT(VARCHAR(2),CalendarMonth),2)
        + RIGHT('0000' + CONVERT(VARCHAR(2),CalendarDay),2) as YearMonthDay
    From DBA.Common.TallyCalendar
    where CalendarDate BETWEEN @StartDatePivot AND @EndDatePivot
),
Hourly
AS (
    SELECT
        TimeStdFormat,
        RIGHT('0000' +
              CONVERT(
                  VARCHAR(2),
                  SUBSTRING(TimeDigitsOnly,1,2)
              ),
              2
        )  as HourDigits
    FROM Common.TimeDimension
    where TimeStdFormat IS NOT NULL
    AND NumMinutes = 0
    AND NumSeconds = 0
),
DateTimes
AS (
    select
        YearMonthDay + HourDigits as DateHourStr,
        YearMonthDay,
        HourDigits
    FROM Dates , Hourly
)
select
    --DateHourStr               as LogDateWithHour,
    YearMonthDay                as LogDayShort,
    '"' + HourDigits + '"'      as LogHourFormattedForExcel,
    ISNULL(DeadlockCount,0)     as DeadlockCount,
    SUBSTRING(YearMonthDay,1,6) as LogMonth
from DateTimes dt
left join DBA.dbo.DeadlockHourlyReport r
on dt.DateHourStr = r.LogDateWithHour
order by DateHourStr,HourDigits
;
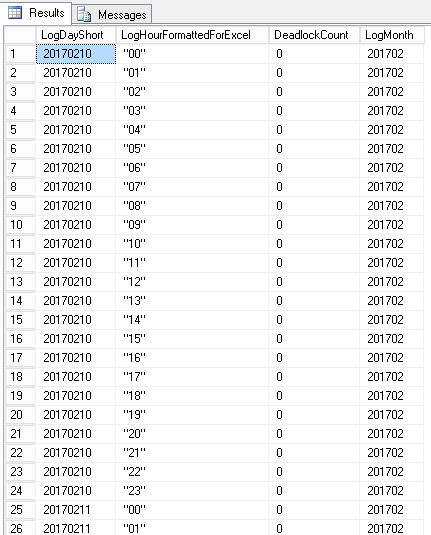
Here are sample results:
以下是示例结果:
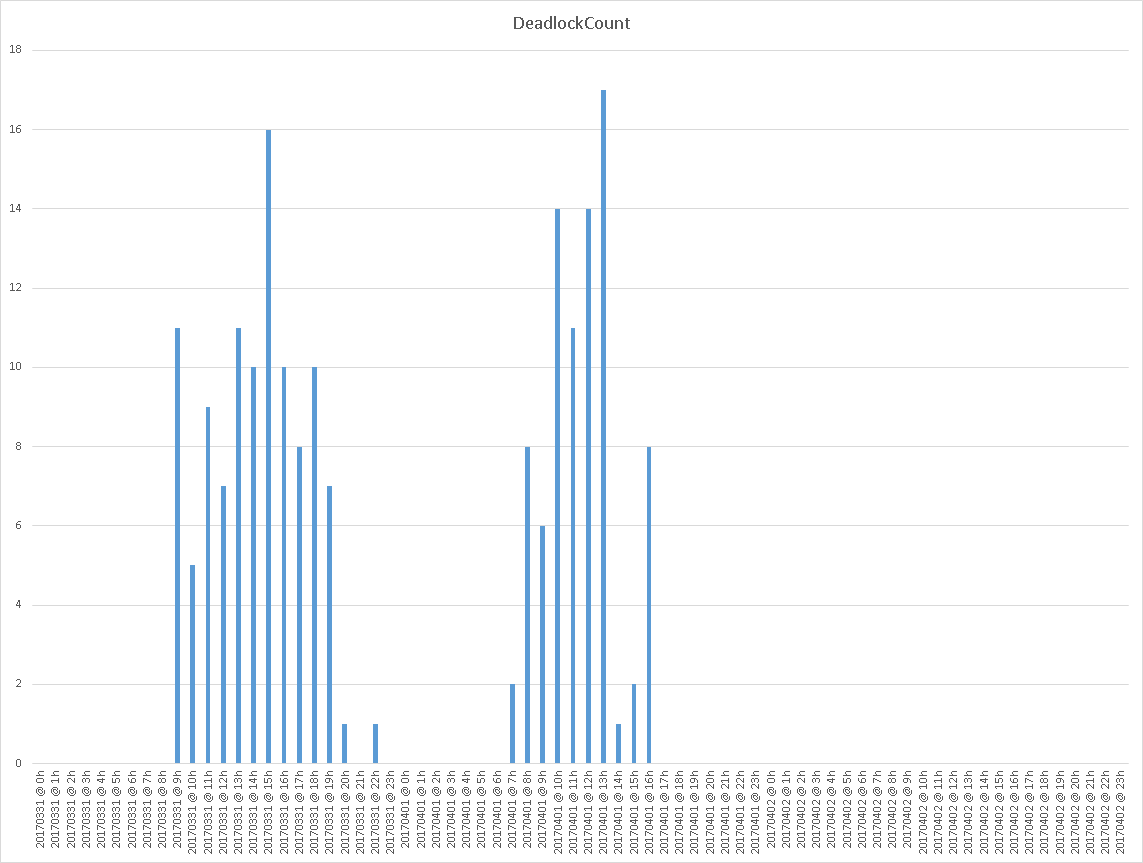
And here is an example graphical representation of these data on a system with deadlocks happening hourly.
这是在每小时发生一次死锁的系统上这些数据的示例图形表示。
As a final word about this method, we should pinpoint that this method is a little tricky as it uses undocumented stored procedures and as it performs mining on the SQL Server Error Log.
最后,我们应该指出该方法有点棘手,因为它使用了未记录的存储过程,并且对SQL Server错误日志进行了挖掘。
While this can be useful in an incremental information collection approach (so as when SQL Server version is below 2008), we could (and should) take advantage of SQL Server Extended Events.
虽然这在增量信息收集方法中很有用(例如,当SQL Server版本低于2008),但我们可以(并且应该)利用SQL Server扩展事件。
SQL Server扩展事件中的死锁发生图 (Deadlock occurrences diagrams from SQL Server Extended Events)
We could do the same way as we did to generate deadlock occurrence timelines from SQL Server Error Log inside a single procedure that would extract, transform and store results in tables.
我们可以采取与在单个过程内从SQL Server错误日志生成死锁发生时间线的方法相同的方法,该过程将提取,转换结果并将结果存储在表中。
But, as we get an XML description out of the box, we can plan to implement advanced reporting and we would use the exact same code in the body of multiple stored procedures. Instead, we will create a stored procedure that will extract deadlock information from Extended Events into a table. The results of this procedure (records in the output table) will be used as input for further processing like generating a deadlock timeline report, which is the actual purpose of this section.
但是,当我们获得现成的XML描述时,我们可以计划实现高级报告,并且在多个存储过程的主体中使用完全相同的代码。 相反,我们将创建一个存储过程,该过程将从“扩展事件”中提取死锁信息到表中。 该过程的结果(输出表中的记录)将用作进一步处理的输入,例如生成死锁时间轴报告,这是本节的实际目的。
Extracting deadlock information from Extended Events
从扩展事件中提取死锁信息
In the previous article, we’ve seen that we can either use system_health default Extended Events Session or create a new one specialized for keeping track of XML deadlock graphs. But there is a point that wasn’t mentioned.
在上一篇文章中 ,我们已经看到我们可以使用system_health默认扩展事件会话,也可以创建一个专门用于跟踪XML死锁图的新会话。 但是有一点没有提到。
Still in this article, we saw that we can get back system_health data using the following query:
仍然在本文中,我们看到我们可以使用以下查询来获取system_health数据:
DECLARE @LineFeedStr	       CHAR(2);
DECLARE @versionNb			int;
DECLARE @EventSessionName	       VARCHAR(256);
DECLARE @tsql				NVARCHAR(MAX);
DECLARE @DeadlockXMLLookup		VARCHAR(4000);

SELECT
@versionNb		= (@@microsoftversion / 0x1000000) & 0xff,
@LineFeedStr		= CHAR(13) + CHAR(10),
@EventSessionName	= ISNULL(@EventSessionName,'system_health')
;

IF (@versionNb = 10)
BEGIN
SET @DeadlockXMLLookup =
'XEventData.XEvent.value(''(data/value)[1]'',''VARCHAR(MAX)'')';
END;
ELSE IF(@versionNb <= 9)
BEGIN
RAISERROR('Extended events feature does not exist in this version',12,1)
WITH NOWAIT;
RETURN;
END;
ELSE
BEGIN
SET @DeadlockXMLLookup = 'XEventData.XEvent.query(''(data/value/deadlock)[1]'')';
END;

SET @tsql = 'WITH DeadlockData' + @LineFeedStr +
		'AS (' + @LineFeedStr +
		'    SELECT' + @LineFeedStr +
		'	    CAST(target_data as xml) AS XMLData' + @LineFeedStr +
		'    FROM' + @LineFeedStr +
		'	    sys.dm_xe_session_targets st' + @LineFeedStr +
		'    JOIN' + @LineFeedStr +
		'	    sys.dm_xe_sessions s ' + @LineFeedStr +
		'    ON s.address = st.event_session_address' + @LineFeedStr +
		'    WHERE name   = ''' + 'system_health' + '''' + @LineFeedStr +
		'    AND st.target_name = ''ring_buffer'' ' + @LineFeedStr +
	')' + @LineFeedStr +
		'SELECT ' + @LineFeedStr +
		'    XEventData.XEvent.value(''@name'', ''varchar(128)'') as
eventName,' + @LineFeedStr +
		'    XEventData.XEvent.value(''@timestamp'', ''datetime2'') as
eventDate,' + @LineFeedStr +
		'    CAST(' + @DeadlockXMLLookup + ' AS XML) AS DeadLockGraph ' +
@LineFeedStr +
		'FROM ' + @LineFeedStr +
		'    DeadlockData' + @LineFeedStr +
		'CROSS APPLY' + @LineFeedStr +
		'    XMLData.nodes(''//RingBufferTarget/event'') AS XEventData
(XEvent)' + @LineFeedStr +
		'WHERE' + @LineFeedStr +
		'    XEventData.XEvent.value(''@name'',''varchar(4000)'') =
''xml_deadlock_report'''  + @LineFeedStr +
		';'
		;
EXEC sp_executesql @tsql;
This query will actually work for any Extended Event Session that has a ring_buffer target type. This is not the case for the [Collect-Deadlocks] event session discussed in that article because its target type is an asynchronous file. We can easily understand it once we run following query and we check for differences between returned data for target_data column.
该查询实际上适用于具有ring_buffer目标类型的任何扩展事件会话。 该文章中讨论的[Collect-Deadlocks]事件会话不是这种情况,因为它的目标类型是异步文件。 一旦运行以下查询,并且针对target_data列检查返回的数据之间的差异,我们就可以轻松理解它。
SELECT * FROM sys.dm_xe_session_targets
Here is a sample output:
这是一个示例输出:

First, we can notice that there is not RingBufferTarget node at the beginning of target_data column, so the CROSS APPLY operation won’t work. But it’s not the only difference! Let’s take a look at the full content of each value…
首先,我们可以注意到target_data列的开头没有RingBufferTarget节点,因此CROSS APPLY操作将不起作用。 但这不是唯一的区别! 让我们看一下每个值的全部内容...
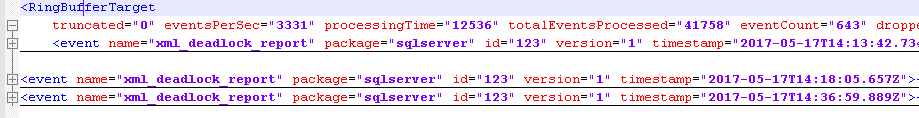
We see that in the case of RingBufferTarget node, there are instances of event sub-nodes named xml_deadlock_report while the FileTarget node doesn’t.
我们看到,对于RingBufferTarget节点,存在名为xml_deadlock_report的事件子节点的实例,而FileTarget节点则没有。
In conclusion, we need to build another query to be able to get back results. Actually, we need to tell SQL Server to read from files. This is performed by sys.fn_xe_file_target_read_file built-in function. But this function needs at least to provide 2 parameters: the path to the file(s) we want to read and the metadata descriptor for the file(s) it has to read. We must compute these values before execution. As this article is not about SQL Server Extended Events, I will just present the resulting query.
总之,我们需要构建另一个查询以获取结果。 实际上,我们需要告诉SQL Server从文件中读取。 这是由sys.fn_xe_file_target_read_file内置函数执行的。 但是此功能至少需要提供2个参数:我们要读取的文件的路径以及必须读取的文件的元数据描述符。 我们必须在执行之前计算这些值。 由于本文与SQL Server扩展事件无关,因此我将仅介绍结果查询。
DECLARE @versionNb          int;
DECLARE @EventSessionName   VARCHAR(256);
DECLARE @DeadlockXMLLookup  VARCHAR(4000);
DECLARE @tsql               NVARCHAR(MAX);
DECLARE @LineFeedStr           CHAR(2);
DECLARE @EventFilePath      VARCHAR(MAX);
DECLARE @EventMetaFilePath  VARCHAR(MAX);

SELECT
    @LineFeedStr           = CHAR(13) + CHAR(10),
    @versionNb          = (@@microsoftversion / 0x1000000) & 0xff,
    @EventSessionName   = 'Collect-Deadlocks'
;

IF(@versionNb < 10)
BEGIN
    RAISERROR('Extended events do not exist in this version',12,1) WITH
NOWAIT;
    RETURN;
END;

SELECT
    @EventFilePath = LEFT(column_value, LEN(column_value) -
CHARINDEX('.', REVERSE(column_value))) + '*' + RIGHT(column_value,
CHARINDEX('.', REVERSE(column_value))-1)
FROM
    sys.dm_xe_sessions s
JOIN
    sys.dm_xe_session_object_columns soc
ON s.address = soc.event_session_address
WHERE
    s.name          = @EventSessionName
AND soc.object_name = 'asynchronous_file_target'
AND soc.column_name = 'filename'
;

-- getting back metadata file path
SELECT
    @EventMetaFilePath = LEFT(column_value, LEN(column_value)-
CHARINDEX('.', REVERSE(column_value))) + '*' + RIGHT(column_value,
CHARINDEX('.', REVERSE(column_value))-1)
FROM
    sys.dm_xe_sessions s
JOIN
    sys.dm_xe_session_object_columns soc
ON s.address = soc.event_session_address
WHERE
    s.name          = @EventSessionName
AND soc.object_name = 'asynchronous_file_target'
AND soc.column_name = ' metadatafile'
;

-- Set the metadata filename if it is NULL to the log file name with xem
extension
SET @EventMetaFilePath = ISNULL(@EventMetaFilePath, LEFT(@EventFilePath,
LEN(@EventFilePath)-CHARINDEX('*', REVERSE(@EventFilePath))) + '*xem') ;


SET @tsql = 'WITH EventsData' + @LineFeedStr +
            'AS (' + @LineFeedStr +
            '    SELECT' + @LineFeedStr +
            '        CAST(event_data AS xml) as XMLData' + @LineFeedStr +
            '    FROM sys.fn_xe_file_target_read_file(N''' +
@EventFilePath + ''', N''' + @EventMetaFilePath + ''', null, null)' +
@LineFeedStr +
            ')' + @LineFeedStr +
            'SELECT' + @LineFeedStr +
            '    --n.value(''(@name)[1]'', ''varchar(100)'') AS
event_name,' + @LineFeedStr +
            '    DATEADD(hh,DATEDIFF(hh,GETUTCDATE(),SYSDATETIME()),n.value(''@timestamp'',
''datetime2'')) as EventDate,' + @LineFeedStr +
            '    CAST(n.value(''(data/value)[1]'',''VARCHAR(MAX)'') AS
xml) as DeadLockGraph' + @LineFeedStr +
            'FROM EventsData ' + @LineFeedStr +
            'CROSS APPLY ' + @LineFeedStr +
            '    XMLData.nodes(''event'') as q(n)' + @LineFeedStr +
            'WHERE ' + @LineFeedStr +
            '    n.value(''(@name)[1]'', ''varchar(100)'') =
''xml_deadlock_report''' + @LineFeedStr +
            ';'
            ;

--PRINT @tsql;
EXEC sp_executesql @tsql;
And here are sample results:
以下是示例结果:
Code reuse
代码重用
Almost all stored procedure will have to check if a table exists and some of them will need to create this table. So, for code reuse, those procedures will call a stored procedure called Utils.CheckTableExists that does the job. This procedure is functional but won’t check table structure. It could be an improvement for this procedure though.
几乎所有存储过程都必须检查表是否存在,其中一些将需要创建该表。 因此,对于代码重用,这些过程将调用执行该任务的称为Utils.CheckTableExists的存储过程。 此过程是有效的,但不会检查表结构。 不过,这可能是对此过程的一种改进。
Some procedure might also use different components for which articles have already been published on SQL Shack. It can also optionally use a table called Common.ApplicationParams that is just a parameter table with following structure:
某些过程可能还会使用已经在SQL Shack上发布过文章的不同组件。 它还可以选择使用名为Common.ApplicationParams的表,该表只是具有以下结构的参数表:
CREATE TABLE [Common].[ApplicationParams](
        [ApplicationName]   [varchar](128)  NOT NULL,
        [ParamName]         [varchar](64)   NOT NULL,
        [ParamValue]        [varchar](max)  ,
        [DefaultValue]      [varchar](max) ,
        [ValueCanBeNULL]    [bit]           DEFAULT 0 NOT NULL,
        [isDepreciated]     [bit]           NOT NULL,
        [ParamDescription]  [varchar](max)  NULL,
        [creationdate]      [datetime]      NOT NULL,
        [lastmodified]      [datetime]      NOT NULL,

        CONSTRAINT [PK_ApplicationParams] PRIMARY KEY CLUSTERED (
            [ApplicationName] ASC,
            [ParamName] ASC
        )
        WITH (
            PAD_INDEX  = OFF,
            STATISTICS_NORECOMPUTE  = OFF,
            IGNORE_DUP_KEY = OFF,
            ALLOW_ROW_LOCKS  = ON,
            ALLOW_PAGE_LOCKS  = ON
        )
        ON [PRIMARY]
    )ON [PRIMARY]
A stored procedure called Common.getApplicationParam is used to get value from this table.
一个称为Common.getApplicationParam的存储过程用于从该表中获取值。
Writing the extraction stored procedure
编写提取存储过程
Now we defined the core components of our extraction, we can build a stored procedure that we can call no matter Extended Event target type. We will call this stored procedure Monitoring.CollectDeadlockInformation. It will have following parameters.
现在,我们定义了提取的核心组件,我们可以构建一个存储过程,无论扩展事件目标类型如何,都可以调用该存储过程。 我们将这个存储过程称为Monitoring.CollectDeadlockInformation 。 它将具有以下参数。
ALTER PROCEDURE [Monitoring].[CollectDeadlockInformation] (
    @OutputType                     VARCHAR(16)     = 'NONE', --
Possible values: NONE, SCHEMA, TABLE
    @EventSessionName               VARCHAR(256)    = 'system_health',
    @EventSessionTargetType         VARCHAR(32)     = NULL,
    @UseApplicationParamsTable      BIT             = 1,
    @ApplicationName                VARCHAR(256)    = '$(SolutionName)',
    @LastCollectionParameterName    VARCHAR(256)    =
'DeadlockEvents:LastCollectionTime',
    @StartDatePivot		            DATETIME2       = NULL,
    @EndDatePivot		            DATETIME2       = NULL,
    @OutputDatabaseName             SYSNAME         = NULL,
    @OutputSchemaName               SYSNAME         = NULL,
    @OutputTableName                SYSNAME         = NULL,
    @OutputAppendMode               BIT             = 1, -- set it to 0
to tell procedure to truncate table before inserting
    @Debug                          BIT             = 0,
    @_NoEventSessionNameCheck       BIT             = 0
)
Note
注意
- The @UseApplicationParamsTable, @ApplicationName and @LastCollectionParameterName are added for automated collection perspective. This automation will be covered in the next article of the series.
- 的@UseApplicationParamsTable,@ApplicationName和@LastCollectionParameterName被添加用于自动收集透视。 该自动化将在本系列的下一篇文章中介绍。
- @_NoEventSessionNameCheck parameter will tell stored procedure to proceed without checking that the event session exists. @_NoEventSessionNameCheck参数将告诉存储过程继续进行,而无需检查事件会话是否存在。
- @OutputType value is TABLE then it will return a dataset with following columns: @OutputType值为TABLE,则它将返回包含以下列的数据集:
- NULL value as NULL值作为DeadlockId DeadlockId
- ServerName, value returned by ServerName ,由@@SERVERNAME @@ SERVERNAME返回的值
- DateStamp, when deadlock is marked to have occurred DateStamp ,当标记为已发生死锁时
- DeadlockGraph, the XML deadlock graph DeadlockGraph ,XML死锁图
- CollectionTime, when stored procedure ran. CollectionTime ,当存储过程运行时。
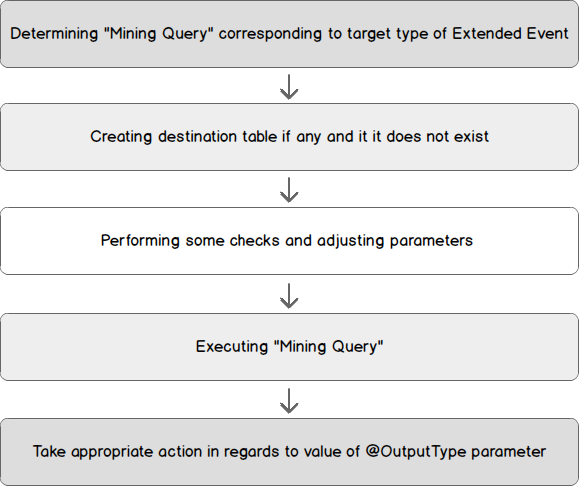
The following steps will compose the body of this stored procedure.
以下步骤将构成此存储过程的主体。
The creation script for this stored procedure and related objects are attached to this article with instructions for setup.
此存储过程和相关对象的创建脚本随附于本文,并附有安装说明。
Writing the reporting stored procedure
编写报告存储过程
The stored procedure presented here is an adaptation of the one we’ve seen for the generation of timelines from SQL Server Error Log. We will call it Reporting.DeadlockTimeLineFromTable. This procedure will generate a single dataset for a given time precision. This precision can be from days to minutes.
此处介绍的存储过程是对我们从SQL Server错误日志中生成时间轴所看到的存储过程的改编。 我们将其称为Reporting.DeadlockTimeLineFromTable 。 此过程将为给定的时间精度生成单个数据集。 这种精度可以从几天到几分钟。
As the extraction procedure might change its destination table, this procedure will take a reference to an input table and will use dynamic SQL to retrieve data. We will also define an output table so that we can query its results a while after it has run without extra computation.
由于提取过程可能会更改其目标表,因此该过程将引用输入表,并将使用动态SQL检索数据。 我们还将定义一个输出表,以便我们可以在运行后查询它的结果,而无需进行额外的计算。
The user will also be able to define a time interval for this report so that only values in that interval will be found in the output dataset.
用户还将能够为此报告定义一个时间间隔,以便在输出数据集中只能找到该间隔中的值。
In addition, we will simplify the transfer to any spreadsheet tool to generate a bar diagram by adding a parameter that will fill the gaps between two records in the source dataset. This is the problem we already mentioned when we extracted deadlock occurrences from the SQL Server Error Log.
此外,我们将通过添加一个参数来填充源数据集中两条记录之间的空白,从而简化向任何电子表格工具的转换以生成条形图。 这是当我们从SQL Server错误日志中提取死锁事件时已经提到的问题。
Finally, we will use the « Generic Reporting Execution Log » implementation presented in the article entitled A T-SQL design pattern for logging process execution.
最后,我们将使用标题为日志记录流程执行的T-SQL设计模式的文章中介绍的“通用报告执行日志”实现。
So, this gives us following interface for Reporting.DeadlockTimeLineFromTable stored procedure:
因此,这为我们提供了Reporting.DeadlockTimeLineFromTable存储过程的以下接口:
PROCEDURE [Reporting].[DeadlockTimeLineFromTable](
    @ReportTemplateName                     VARCHAR(256)    = NULL ,
    -- "Hour" | "minute" | "Day" | NULL
    @SourceDatabaseName                     VARCHAR(256)    = NULL,
    @SourceSchemaName                       VARCHAR(256)    = NULL,
    @SourceTableName                        VARCHAR(256),
    @SourceTimeColumnName                   VARCHAR(256),
    @FilterStartDate                        DATETIME        = NULL,
    @FilterEndDate                          DATETIME        = NULL,
    @OutputType                             VARCHAR(32)     = 'NONE',
    -- NONE | TABLE | SCHEMA
    @OutputDatabaseName                     VARCHAR(256)    = NULL,
    @OutputSchemaName                       VARCHAR(256)    = NULL,
    @OutputTableName                        VARCHAR(256)    = NULL,
    @FillTimeGaps                           BIT             = 0,
    @Debug                                  BIT             = 1
)
Note
注意
We could also refactor Reporting.DeadlockTimeLine stored procedure presented above to a procedure that would just extract deadlock occurrences from SQL Server Error Log to a table. (We could call this procedure Monitoring.CollectDeadlockInformationInLegacyMode).
我们还可以将上面介绍的Reporting.DeadlockTimeLine存储过程重构为一个过程,该过程将从SQL Server错误日志中提取死锁事件到表中。 (我们可以将此过程称为Monitoring.CollectDeadlockInformationInLegacyMode) 。
If we do that, we could use Reporting.DeadlockTimeLineFromTable stored procedure to also generate reports based on its output table.
如果这样做,我们可以使用Reporting.DeadlockTimeLineFromTable存储过程还根据其输出表生成报告。
摘要 (Summary)
In the last article, we’ve seen what deadlocks are and how to keep track of them. In this article, we’ve seen two approaches to extract information:
在上一篇文章中,我们已经看到了什么是僵局以及如何跟踪它们。 在本文中,我们已经看到了两种提取信息的方法:
- Reading and parsing the SQL Server Error Log 读取和解析SQL Server错误日志
- Reading SQL Server Extended Events feature 读取SQL Server扩展事件功能
For the second approach, we also defined the basis or the input of a process that would allow us to answer questions like “What applications are mostly implied in deadlocks?” or “Which queries lead to deadlock?” and so on. We will review this process in the next article.
对于第二种方法,我们还定义了流程的基础或输入,使我们能够回答诸如“死锁中最隐含哪些应用程序?”之类的问题。 或“哪个查询导致死锁?” 等等。 我们将在下一篇文章中回顾此过程。
Other articles in this series:
本系列的其他文章:
- What are SQL Server deadlocks and how to monitor them 什么是SQL Server死锁以及如何监视死锁
- How to use SQL Server Extended Events to parse Deadlock XML and generate statistical reports 如何使用SQL Server扩展事件来解析死锁XML并生成统计报告
- How to automate SQL Server deadlock collection process using Extended Events and SQL Server Agent如何使用扩展事件和SQL Server代理自动执行SQL Server死锁收集过程
资料下载 (Downloads)
翻译自: https://www.sqlshack.com/report-sql-server-deadlock-occurrences/
sql server死锁


 2029
2029

 被折叠的 条评论
为什么被折叠?
被折叠的 条评论
为什么被折叠?
 到【灌水乐园】发言


