


 了解SQL Server Management Studio中的标准报告,包括活动监视器、数据收集集和服务器仪表板,用于SQL Server性能监控和故障排除。
Activity Monitor Activity Monitor is one of the features available in SQL Server Management Studio that quickly provides a set of most common performance metric values. What makes it more useful is that no previous setup is needed. Metrics are available at just a couple of clicks.
活动监视器活动监视器是SQL Server Management Studio中可用的功能之一,可快速提供一组最常见的性能指标值。 使它更有用的是,不需要以前的设置。 只需点击几下即可获得指标。
Keep in mind that the feature provides only basic information for a pre-defined set of SQL Server performance metrics, not useful for any deeper investigation and troubleshooting. No customization is possible. The metrics are shown in real-time graphs, they cannot be saved for later analysis, nor threshold values specified. But it can be useful to begin with performance monitoring and troubleshooting.
请记住,该功能仅提供一组预定义SQL Server性能指标的基本信息,对于进行任何更深入的调查和疑难解答没有帮助。 无法自定义。 指标显示在实时图形中,无法保存以供以后分析,也不能指定阈值。 但是从性能监视和故障排除开始可能会很有用。
Data collection sets Starting with SQL Server 2008, data collection sets via Management Data Warehouse are available. Data collection provides three built-in collection sets; additional ones can be added through code. Unlike Activity Monitor, they are not available out of the box. Management Data Warehouse and collection sets have to be configured and started in advance.
数据收集集从SQL Server 2008开始,可以通过管理数据仓库获取数据收集集。 数据收集提供三个内置的收集集; 其他代码可以通过代码添加。 与活动监视器不同,它们不是开箱即用的。 必须预先配置和启动管理数据仓库和收集集。
Standard reports The largest set of SQL Server performance metric reports available in SQL Server Management Studio are Standard reports. It is a set of built-in reports that cover most common performance and monitoring requirements. The feature was introduced in SQL Server 2005. The available reports have changed over time, but the logic behind them is the same.
标准报告 SQL Server Management Studio中可用的最大SQL Server性能指标报告集是标准报告 。 它是一组内置报告,涵盖了最常见的性能和监视要求。 该功能是在SQL Server 2005中引入的。可用的报告随着时间的推移而发生了变化,但是其背后的逻辑是相同的。
The same as with Activity Monitor, no previous configuration and customization is needed. These reports cannot be customized, no history saved, no alerting supported. However, the range of available reports is much larger than in Activity Monitor.
与Activity Monitor相同,不需要以前的配置和自定义。 这些报告无法自定义,不保存历史记录,不支持警报。 但是,可用报告的范围比Activity Monitor中的要大得多。
Standards reports are available at different database object levels. There are SQL Server instance level reports, login reports, management reports, SQL Server Agent, and more.
标准报告在不同的数据库对象级别可用。 有SQL Server实例级别的报告,登录报告,管理报告,SQL Server代理等。
Some object types have disabled the Reports item in their content menu, which means that no reports are available for that object level. Besides these standard reports, there are custom ones. They are supported for most of database object types.
某些对象类型已禁用其内容菜单中的“报告”项,这意味着该对象级别没有可用的报告。 除了这些标准报告,还有自定义报告。 大多数数据库对象类型都支持它们。
SQL Server instance standard reports SQL Server Management Studio provides a widest range of standard reports for the SQL Server instance level. There are more than 20 reports that show the most important SQL Server performance metrics, change history, memory usage, activity, top transactions, performance Service Broker statistics, and transaction log shipping status.
SQL Server实例标准报告 SQL Server Management Studio为SQL Server实例级别提供了最广泛的标准报告。 有20多个报告显示最重要SQL Server性能指标,更改历史记录,内存使用情况,活动,主要事务,性能Service Broker统计信息和事务日志传送状态。
They can be used to quickly identify memory issues, most expensive queries, blocking transactions, and more.
它们可用于快速识别内存问题,最昂贵的查询,阻止事务等等。
Server dashboard Contains the information commonly analyzed when it comes to SQL Server performance monitoring. It shows the basic information about SQL Server instance configuration, settings, and activity in charts and tables: configuration details, non-default configuration options (in case you’ve modified the default instance settings), activity details, and graphs for processor usage and I/O performed.
服务器仪表板包含有关SQL Server性能监视的常用分析信息。 它在图表和表格中显示有关SQL Server实例配置,设置和活动的基本信息:配置详细信息,非默认配置选项(如果您已经修改了默认实例设置),活动详细信息以及用于处理器使用情况的图表已执行I / O。
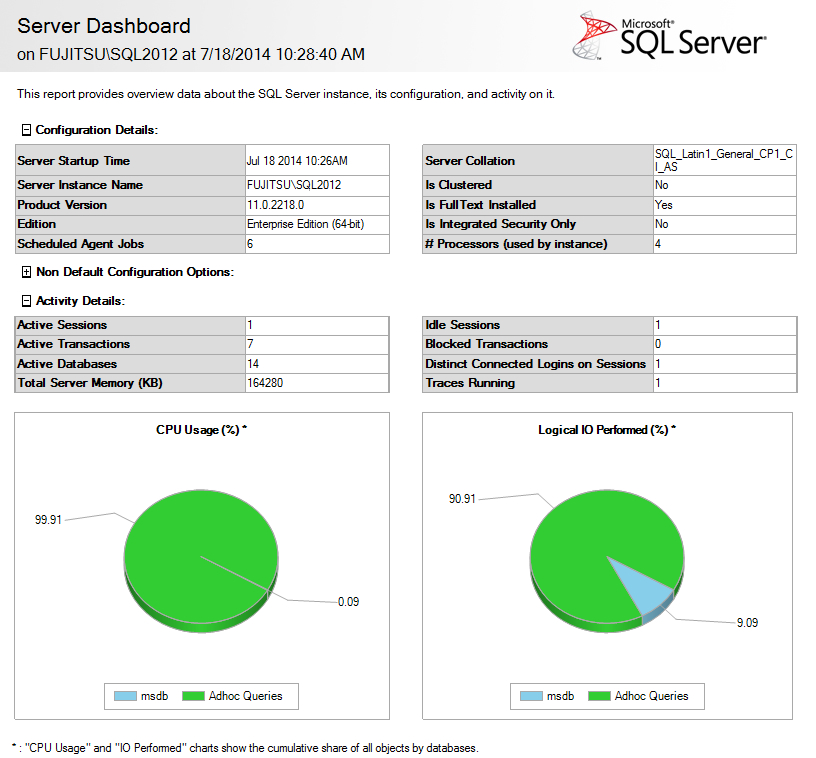
The same as other standard reports, this report contains expandable sections that provide additional detailed about specific metric or option.
与其他标准报告相同,此报告包含可扩展的部分,其中提供了有关特定指标或选项的更多详细信息。
Memory Consumption Memory Consumption is useful for troubleshooting memory issues and bottlenecks.
内存消耗 内存消耗对于解决内存问题和瓶颈很有用。
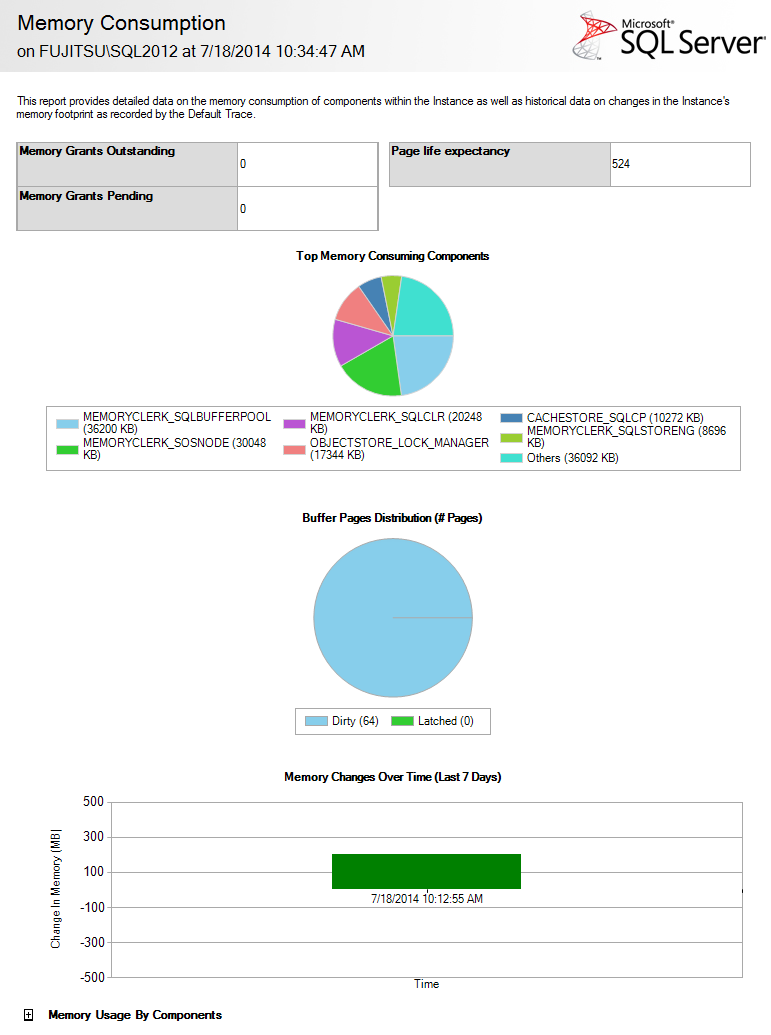
It shows the number of Memory grants outstanding, Memory grants pending, and Page life expectancy. These values can also be obtained by querying the sys.dm_os_performance_counters dynamic management view. Although these are not the most important memory metrics, they can be useful for basic analysis of the server memory usage. Additional memory performance metrics are not shown, nor can be added.
它显示了未完成的内存授予数, 待处理的内存授予数和预期的页面寿命。 也可以通过查询sys.dm_os_performance_counters动态管理视图来获取这些值。 尽管这些不是最重要的内存指标,但它们对于服务器内存使用情况的基本分析很有用。 其他内存性能指标未显示,也无法添加。
Memory grants outstanding shows the total number of processes that have been successfully granted a workspace in memory.
未完成的内存授予显示已成功授予内存中的工作空间的进程总数。
Memory grants pending shows the number of processes that are still waiting to be granted a workspace in memory.
未决的内存授予将显示仍在等待授予内存中的工作空间的进程数。
Page life expectancy shows how many seconds a page stays in the buffer pool. If it’s not is the buffer pool, it has to be read from disk, so performance is affected. The preferred value is over 300, although this metric is not as useful as believed earlier.
页面预期寿命显示页面在缓冲池中停留的秒数。 如果不是缓冲池,则必须从磁盘读取它,因此会影响性能。 尽管此度量标准不如先前所相信的那样有用,但它的首选值为300以上。
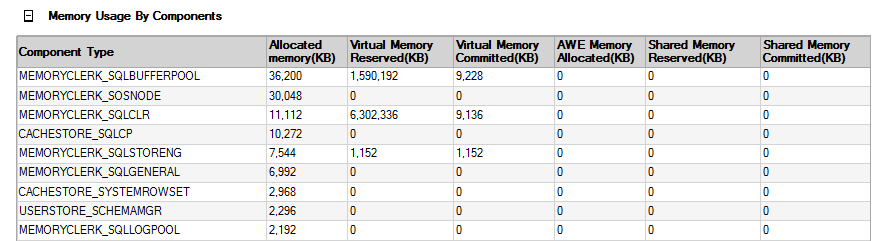
The Memory usage by components section, when expanded, shows a long list of SQL Server components and the allocated, virtual, and shared memory reserved and committed. This information can also be obtained by querying the sys. dm_os_memory_clerks dynamic management view. MEMORYCLERK_SQLBUFFERPOOL is usually the biggest memory consumer.
展开的“ 按组件划分的内存使用情况”部分将显示一长串SQL Server组件以及已分配和保留的虚拟内存和共享内存。 该信息也可以通过查询sys获得。 dm_os_memory_clerks动态管理视图。 MEMORYCLERK_SQLBUFFERPOOL通常是最大的内存使用者。
Here is just a fragment from the Memory usage by components list:
这只是“ 按组件使用内存”列表的一部分:
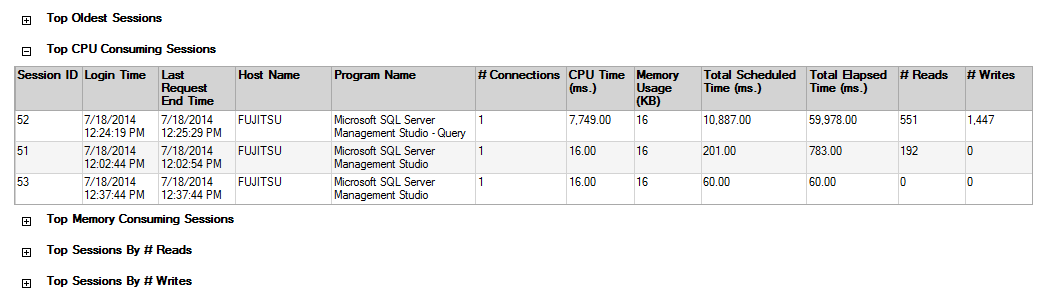
Activity There are seven available activity reports that show information about active sessions (both internal and external), connections, cursors, and transactions. The report shows top oldest, CPU consuming, and memory consuming sessions, as well as top sessions by number of reads, and by number of writes.
活动有七个可用的活动报告,这些报告显示有关活动会话(内部和外部),连接,游标和事务的信息。 该报告显示了最旧的,CPU使用率和内存消耗最大的会话,以及按读取次数和写入次数列出的最高会话。
As the reports show host and program name, they enable you to nail down who uses most resources, from which computer and program.
当报告显示主机名和程序名时,它们使您能够确定谁使用最多的资源,资源来自哪台计算机和程序。
Performance –Top Queries by Average CPU Time and Top Queries by Total CPU Time These report show ten most expensive queries when it comes to processor time usage. The information they show is the same, just grouped and presented differently. They show the exact query (system or user) executed, the database and object they are executed against, and the number of milliseconds the processor needed to process each of these queries.
性能–按平均CPU时间的最高查询和按CPU总时间的最高查询这些报告显示有关处理器时间使用情况的十个最昂贵的查询。 他们显示的信息是相同的,只是分组和呈现的方式不同。 它们显示执行的确切查询(系统或用户),针对它们执行的数据库和对象,以及处理器处理这些查询中的每一个所需的毫秒数。
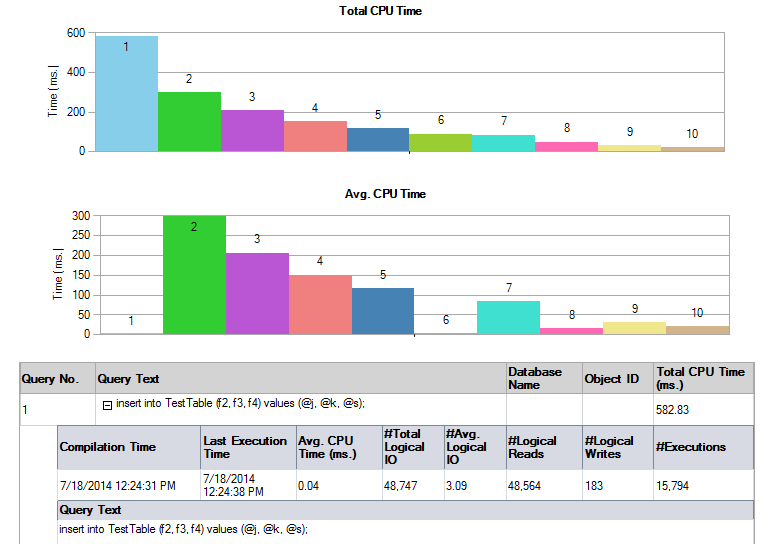
The Top Queries by Total CPU Time shows the same data and graphs as Top Queries by Average CPU Time, but in different order (Total CPU time is first).
“ 按总CPU时间排列的热门查询”与“按平均CPU时间排列的热门查询”显示的数据和图形相同,但顺序不同(“总CPU时间”排在第一位)。
The same goes for Performance –Top Queries by Average IO and Top Queries by Total IO Note that some of these reports use more hardware resources and need time to be created and displayed. Therefore, it is recommended to run them during off-peak hours.
性能-按平均IO的热门查询和按总IO的热门查询也是如此。请注意,其中一些报告使用更多的硬件资源,并且需要创建和显示时间。 因此,建议在非高峰时间运行它们。
Tasks Besides the instance-level reports shown above, we’ll present a management-level Tasks report.
任务除了上面显示的实例级报告外,我们还将提供管理级任务报告。
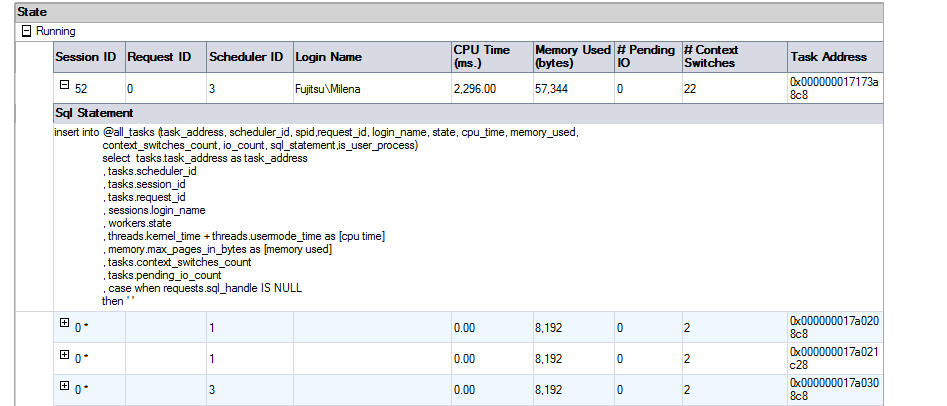
It shows the tasks that are currently executed on your SQL Server instance, so this information is also useful for performance and blocking troubleshooting. Besides the executed statement, the reports also shows processor time, memory used, pending IO. Blocked and blocking tasks are shown in a separate section.
它显示了当前在SQL Server实例上执行的任务,因此此信息对于性能和阻止故障排除也很有用。 除了已执行的语句外,这些报告还显示处理器时间,已使用的内存以及未决的IO。 被阻止的任务和阻止的任务在单独的部分中显示。
如何使用标准报告 (How to use Standard reports)
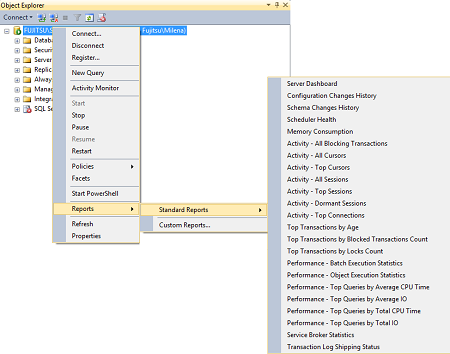
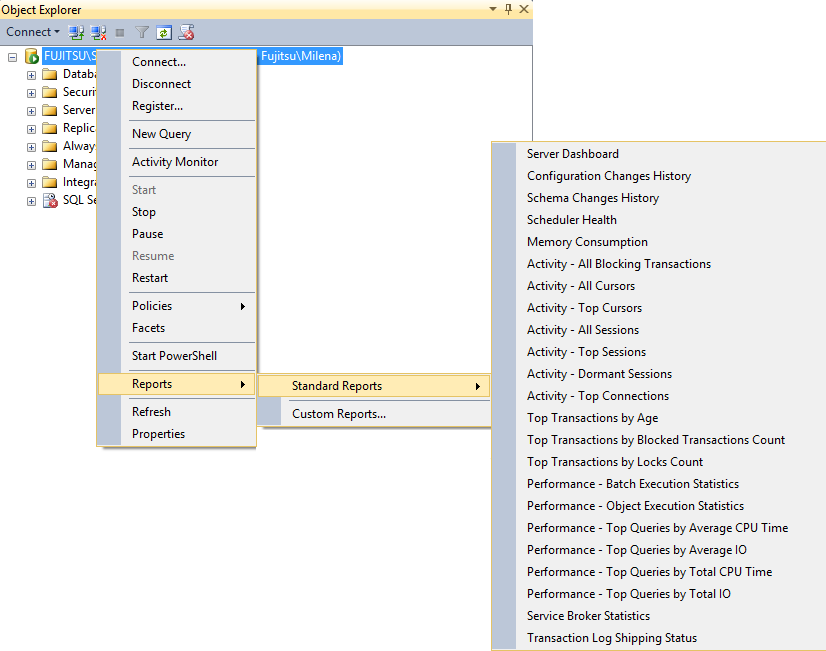
- In SQL Server Management Studio Object Explorer, right-click the SQL Server instance if you want the instance level reports, or the database object node for adequate standards reports
- 在SQL Server Management Studio 对象资源管理器中 ,如果要实例级别的报告,请右键单击SQL Server实例;对于适当的标准报告,请右键单击数据库对象节点
- In the context menu, select Reports | Standard reports
- 在上下文菜单中,选择“报告” |“报告”。 标准报告
Select the report from the list
从列表中选择报告
If you have already viewed some of the reports, the most recent ones will be listed below Custom Reports
如果您已经查看了一些报告,则最新报告将列在“ 自定义报告”下方
- Custom reports, you’ll be prompted to navigate to the folder where custom reports are saved. These are the .rdl and .rdlc files. If you haven’t created or used any custom reports on this SQL Server instance, the menu will be empty.自定义报告 ,系统将提示您导航到保存自定义报告的文件夹。 这些是.rdl和.rdlc文件。 如果尚未在此SQL Server实例上创建或使用任何自定义报告,则菜单将为空。
- Right-click the report and print it or save as an Excel or PDF file 右键单击该报告并打印或另存为Excel或PDF文件
If you’re looking for quick and basic details about SQL Server performance, SQL Server Management Studio standard reports can help. If you want to monitor your servers constantly, be able to select the performance metrics to monitor and configure their thresholds for alerting, keep history for later analysis, this is not the tool. A specialized SQL Server performance monitoring tool is highly recommended in these cases.
如果您正在寻找有关SQL Server性能的快速基本信息,则SQL Server Management Studio标准报告会有所帮助。 如果要持续监视服务器,则可以选择性能指标以监视和配置警报阈值,保留历史记录以供以后分析,这不是工具。 在这些情况下,强烈建议使用专用SQL Server性能监视工具。
翻译自: https://www.sqlshack.com/sql-server-management-studio-performance-reports/


 4344
4344

 被折叠的 条评论
为什么被折叠?
被折叠的 条评论
为什么被折叠?
 到【灌水乐园】发言


