


Activity Monitor provides values for a pre-defined set of SQL Server performance metrics. These sets cannot be customized, nor additional ones added. Data collection also has pre-defined performance metrics sets, although it enables creating new ones through code. Both features provide only basic performance information, insufficient for any deeper analysis or troubleshooting.
活动监视器为一组预定义SQL Server性能指标提供值。 这些集不能自定义,也不能添加其他集。 数据收集还具有预定义的性能指标集,尽管它可以通过代码创建新的指标。 这两个功能仅提供基本的性能信息,不足以进行更深入的分析或故障排除。
Standards SQL Server Management Studio reports provide basic information about memory consumption, processor time used by queries, SQL Server configuration, settings, etc., commonly needed for performance monitoring and troubleshooting. These are available for different database object types and at different levels. The most numerous are standard reports at SQL Server instance level. Although they provide a wide range of performance related information, the standards reports don’t provide enough details for analysis, issue pinpointing, and troubleshooting.
标准SQL Server Management Studio报表提供有关内存消耗,查询使用的处理器时间,SQL Server配置,设置等的基本信息,这通常是性能监视和故障排除所需的信息。 这些可用于不同的数据库对象类型和不同的级别。 数量最多的是SQL Server实例级别的标准报告。 尽管它们提供了大量与性能相关的信息,但是标准报告却没有提供足够的详细信息来进行分析,确定问题和进行故障排除。
To help SQL Server DBAs obtain more details about performance metrics, Microsoft has created a set of free performance dashboard reports . These are actually custom reports created to provide frequently required deeper performance monitoring information, not available in the standard reports. As such, they can be additionally modified and tweaked.
为了帮助SQL Server DBA获得有关性能指标的更多详细信息,Microsoft创建了一组免费的性能仪表板报告 。 这些实际上是自定义报告,创建这些报告是为了提供经常需要的更深入的性能监视信息,而这些信息在标准报告中不可用。 这样,可以对它们进行其他修改和调整。
If these still don’t provide enough information about performance metrics, you can create a custom report yourself.
如果这些仍然无法提供有关性能指标的足够信息,则可以自己创建一个自定义报告。
什么是自定义报告? (What is a custom report?)
A custom report is an rdl file created using Report Definition Language (RDL).
定制报告是使用报告定义语言(RDL)创建的rdl文件。
It presents the data obtained by T-SQL queries and stored procedures from SQL Server databases in a format you specify. You can use any of the built-in report layouts and tweak it later.
它以您指定的格式显示通过T-SQL查询和存储过程从SQL Server数据库获得的数据。 您可以使用任何内置的报告布局,并在以后进行调整。
To understand an rdl file, start with opening it in a text editor. It’s an XML file where the first part contains the report layout information (in the ReportItems or ReportParameters tag) and the second contains code used to retrieve the data shown in the report (in the DataSets or DataSources tag).
要了解rdl文件,请先在文本编辑器中打开它。 这是一个XML文件,其中第一部分包含报告布局信息(在ReportItems或ReportParameters标记中),第二部分包含用于检索报告中显示的数据的代码(在DataSets或DataSources标记中)。
Custom reports are available in SQL Server 2005 Service Pack 2 and later.
SQL Server 2005 Service Pack 2和更高版本中提供了自定义报告。
Prerequisites
先决条件
To create a custom report, you need SQL Server Data Tools (SSDT).
若要创建自定义报告,您需要SQL Server数据工具(SSDT)。
SQL Server Data Tools can be installed using its standalone installer or the SQL Server installer. It is available in all SQL Server 2012 and later editions, except Express and Express with Tools, and is a replacement for Business Intelligence Development Studio (BIDS).
可以使用其独立安装程序或SQL Server安装程序来安装SQL Server数据工具。 除Express和Express with Tools外,它在所有SQL Server 2012和更高版本中均可用,并且是Business Intelligence Development Studio(BIDS)的替代品。
SQL Server Data Tools is contained in the Visual Studio Shell.
SQL Server数据工具包含在Visual Studio Shell中。
How to create a custom report
如何创建自定义报告
- SQL Server Data ToolsSQL Server数据工具
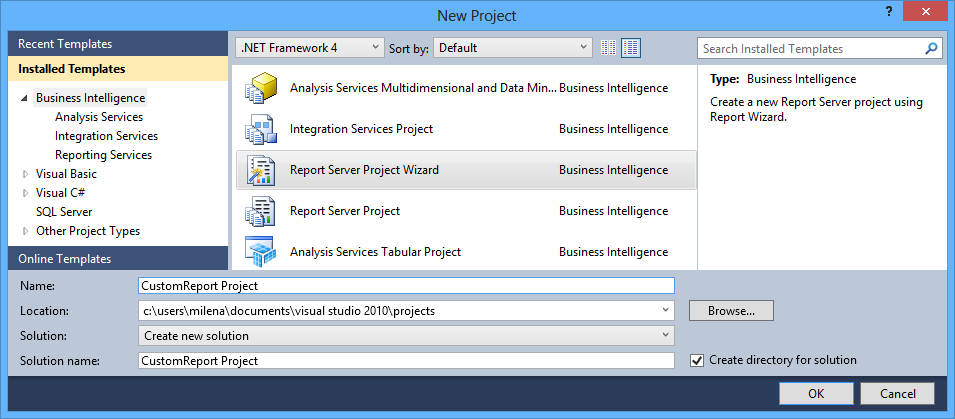
- File, then File ,然后选择New | New |。 Project项目
- Installed Templates list, select 已安装的模板”列表中,选择“ Business Intelligence, 商业智能” , Report Server Project Wizard“报表服务器项目向导”。
Modify the Name, Location, Solution, and Solution name if needed and click OK
如果需要,修改Name , Location , Solution和Solution名称 ,然后单击OK。
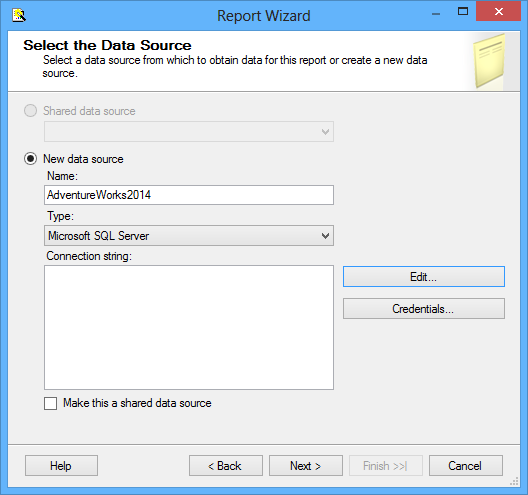
In the Report Wizard, select New data source, enter a name that describes the data source, and select Microsoft SQL Server as Type
在“ 报表向导”中 ,选择“ 新建数据源” ,输入描述数据源的名称,然后选择“ Microsoft SQL Server”作为“ 类型”。
- Make this a shared data source option设为共享数据源”选项
- Edit编辑
Select the SQL Server instance name from the drop-down list, authentication type, and database name
从下拉列表中选择SQL Server实例名称,身份验证类型和数据库名称
- Test the connection to check whether the settings are correct 测试连接以检查设置是否正确
- OK确定
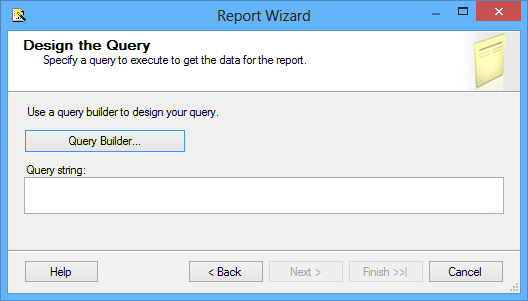
In the Design the Query step, click Query Builder
在“ 设计查询”步骤中 ,单击“ 查询生成器”
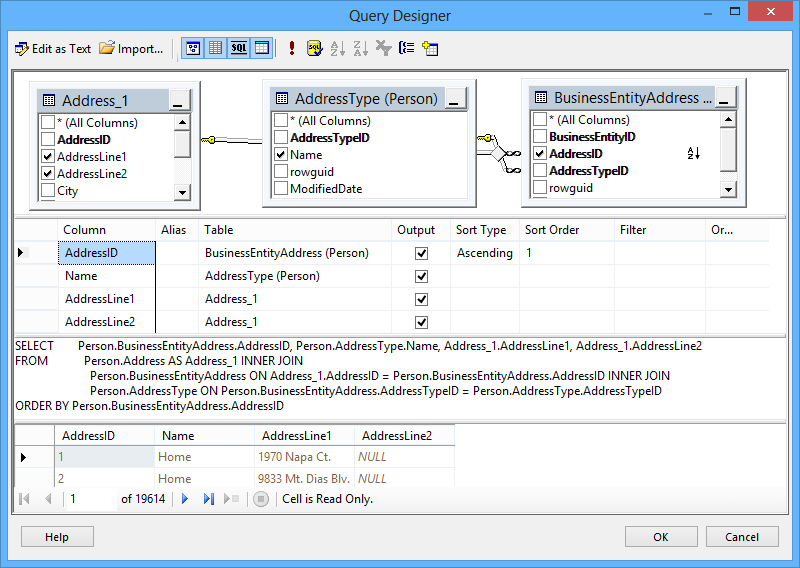
Query Builder enables you to create code that retrieves the data shown in the report either by using visual presentation of tables, views, functions, and synonyms (similar to View designer in SQL Server Management Studio), or by writing code manually.
使用Query Builder,您可以创建代码来检索报表中显示的数据,方法是使用表,视图,函数和同义词的可视表示形式(类似于SQL Server Management Studio中的View设计器 ),或者手动编写代码。
If you use the visual presentation, add the objects you will query using Add Table in the menu and select the check boxes of the columns you want to see in the report.
如果使用视觉演示,请使用菜单中的“ 添加表”添加要查询的对象,然后选中要在报告中查看的列的复选框。
Keep in mind that some of the statements, including the CROSS APPLY that we will use in the following example, cannot be presented graphically. The objects used in such queries will not be shown in the Diagram pane, and an error will be shown. Nevertheless, the T-SQL statement will be executed correctly. Also, note that system objects (including dynamic management views) cannot be added via the Add Table icon in the menu.
请记住,以下语句(包括我们将在以下示例中使用的CROSS APPLY)不能以图形方式显示。 这些查询中使用的对象将不会显示在“ 图”窗格中,并且会显示错误。 但是,T-SQL语句将正确执行。 另外,请注意,不能通过菜单中的“ 添加表”图标添加系统对象(包括动态管理视图)。
There is a workaround to get a system object in the Diagram pane and combine it with other objects. Paste into the SQL pane and execute a statement that contains the system object you want to show, such as:
有一种解决方法可在“ 图”窗格中获取系统对象并将其与其他对象组合。 粘贴到“ SQL”窗格中并执行包含要显示的系统对象的语句,例如:
SELECT * FROM Sys.Dm_Exec_Query_StatsAnd use Add Table to add additional user tables.
并使用“ 添加表”添加其他用户表。
Query Builder supports two command types: text and stored procedure. To toggle between these two types, click Edit as Text in the menu.
查询生成器支持两种命令类型:文本和存储过程。 要在这两种类型之间切换,请在菜单中单击“ 编辑为文本 ”。
The text command type works with T-SQL statements, the same as in SQL Server Management Studio Query tabs.
文本命令类型适用于T-SQL语句,与SQL Server Management Studio的“ 查询”选项卡相同。
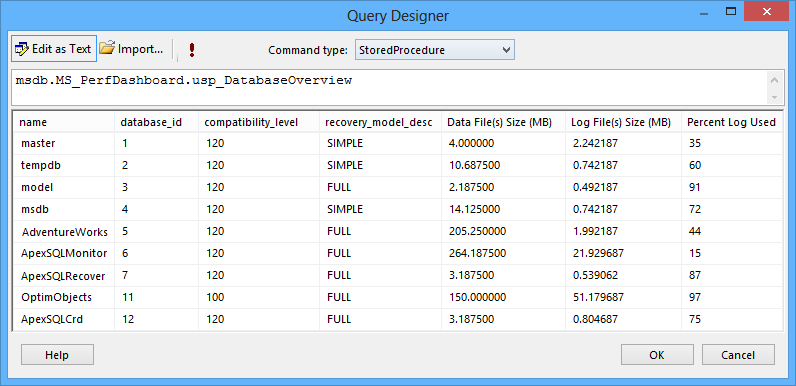
When you want to execute a stored procedure, use the stored procedure command type. You don’t have to write anything other than the stored procedure name (not even EXEC or EXECUTE). You can add the stored procedure parameters once you click Run in the menu.
当您要执行存储过程时,请使用存储过程命令类型。 除了存储过程名称外,您无需写其他任何东西(甚至不需要EXEC或EXECUTE)。 单击菜单中的运行后 ,即可添加存储过程参数。
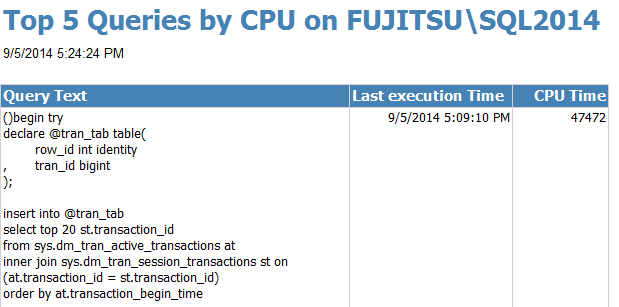
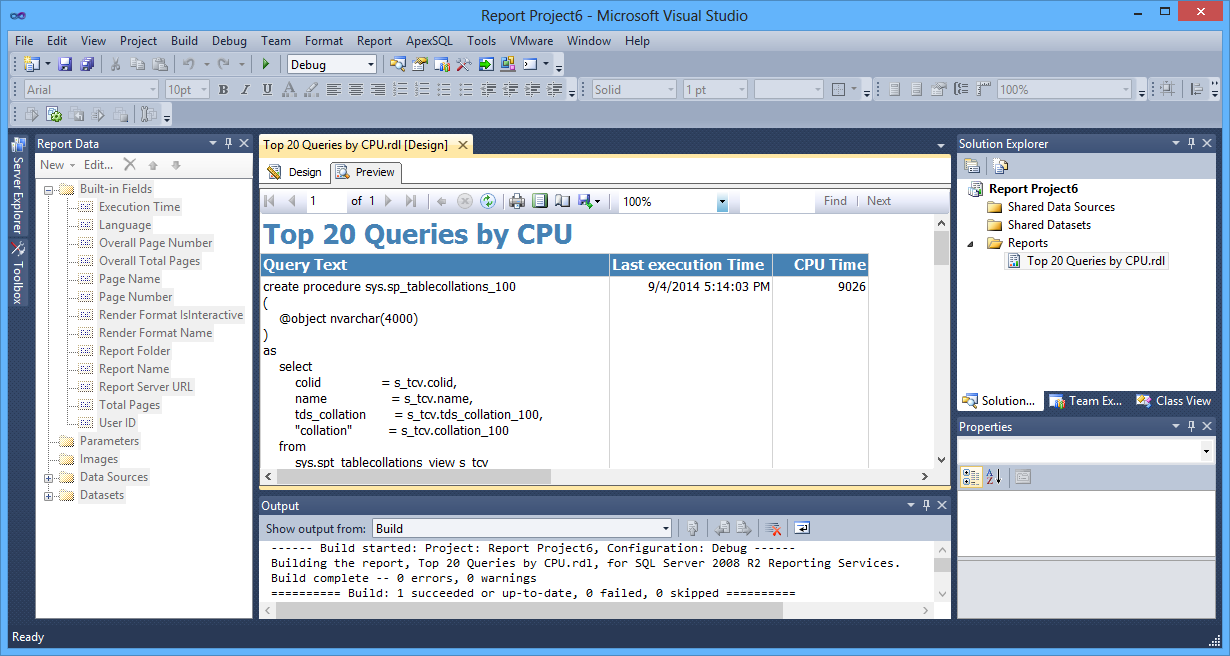
In this example, we’ll create a report that returns 20 most expensive queries executed after 5 PM. You can paste the following script directly into the Query Builder SQL pane.
在此示例中,我们将创建一个报告,该报告返回5 PM之后执行的20个最昂贵的查询。 您可以将以下脚本直接粘贴到“ 查询生成器SQL”窗格中。
SELECT TOP 20 QText.Text AS QueryText, QStat.Last_execution_Time, QStat.Total_Worker_Time AS CPU_Time FROM SYS.Dm_Exec_Query_Stats QStat CROSS APPLY SYS.Dm_Exec_Sql_Text(QStat.SQL_Handle) AS QText WHERE CAST(QStat.Last_execution_Time AS TIME) > '17:00:00';- Run in the 查询生成器”菜单中单击Query Builder menu. You’ll receive a warning that the query cannot be presented graphically as the CROSS APPLY statement is not supported“运行” 。 您会收到警告,因为不支持CROSS APPLY语句,因此无法以图形方式显示查询
- Continue. The results will be shown in the Result pane继续。 结果将显示在“结果”窗格中
- OK and then 确定 ,然后单击Next下一步
- In the following three steps, define the report layout and design. The first one prompts you to select a report type: tabular or matrix. Although a matrix report is not adequate for all result sets returned by the query, the option is always enabled 在以下三个步骤中,定义报告的布局和设计。 第一个提示您选择报告类型:表格或矩阵。 尽管矩阵报告不足以查询返回的所有结果集,但始终启用该选项
- The next step prompts you to specify the fields that will be used to group the data in the table or matrix. In this example, we’ll leave all fields blank 下一步将提示您指定将用于对表或矩阵中的数据进行分组的字段。 在此示例中,我们将所有字段留空
- In the next step, select one of several predefined table styles. The difference is only in the colors and fonts used. You can skip this step and make font and color modifications later 在下一步中,选择几种预定义的表格样式之一。 区别仅在于所使用的颜色和字体。 您可以跳过此步骤,稍后再进行字体和颜色修改
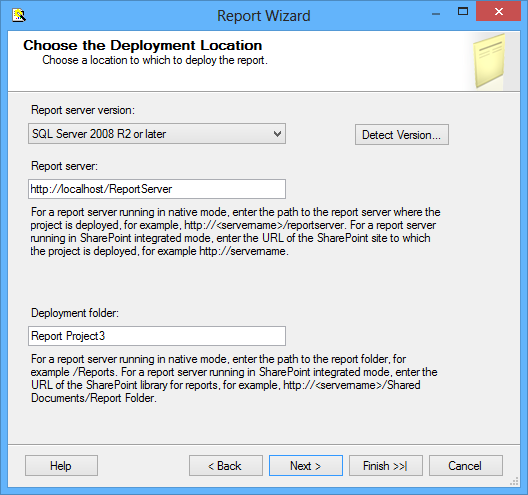
The Choose the Deployment Location step is related only to the report server in SQL Server Reporting Services (SSRS). You will be able to use the custom report through SQL Server Management Studio even if you don’t have SQL Server Reporting Services installed, configured, and running. In that case, you can just leave the values offered by default and click Next
选择部署位置步骤仅与SQL Server Reporting Services(SSRS)中的报表服务器有关。 即使您没有安装,配置和运行SQL Server Reporting Services,也可以通过SQL Server Management Studio使用自定义报告。 在这种情况下,您可以保留默认提供的值,然后单击“ 下一步”。
- Finish完成
If you checked Preview report, the report will be shown in SQL Server Data Tools and you can tweak its layout in the Design tab if needed.
如果选中了预览报告 ,该报告将显示在SQL Server数据工具中,并且您可以根据需要在“ 设计”选项卡中调整其布局。
In this article, we presented SQL Server Management Studio custom reports, explained when they should be used, and gave a stop-by-step guide to create them using SQL Server Data Tools. In the next part of this article, we will give show how to run and modify custom reports.
在本文中,我们介绍了SQL Server Management Studio自定义报告,解释了何时使用它们,并提供了使用SQL Server数据工具创建它们的逐步指南。 在本文的下一部分中,我们将展示如何运行和修改自定义报告。
翻译自: https://www.sqlshack.com/using-custom-reports-improve-performance-reporting-sql-server-2014-basics/


 492
492


 被折叠的 条评论
为什么被折叠?
被折叠的 条评论
为什么被折叠?
 到【灌水乐园】发言


