


sql查询初学者指南
In this article, we will continue to learn essential techniques of the SQL Server query tuning with practical examples.
在本文中,我们将通过实际示例继续学习SQL Server查询调优的基本技术。
Query tuning is a bit complicated issue and if any database programmer wants to be successful on this topic, they can start with learning these basic methods to improve their skill. These methods can be quickly applicable to problematic queries as a solution and can be obtained dramatic performance improvements. The following items are the most known practical methods to improve the performance of the queries.
查询调优是一个有点复杂的问题,如果任何数据库程序员都希望在此主题上取得成功,则可以从学习这些基本方法开始以提高他们的技能。 这些方法可以快速应用于有问题的查询作为解决方案,并且可以显着提高性能。 以下各项是提高查询性能的最已知的实用方法。
- Avoid using the asterisk “*” sign in SELECT statements 避免在SELECT语句中使用星号“ *”
- Don’t use functions in the WHERE clause 不要在WHERE子句中使用函数
- Use the covering indexes 使用覆盖指数
- Use the UNION ALL operator instead of the UNION operator 使用UNION ALL运算符,而不是UNION运算符
- Use Actual Execution Plans instead of Estimated Execution Plans 使用实际执行计划而不是估计执行计划
- You can find all these tips in detail in Getting started with SQL Server Query Tuning article.
- 您可以在“ SQL Server查询优化入门”一文中 找到所有这些提示的详细信息 。
Now we’re going to add three more items to the list and talk about it, and we’re also going to reinforce our learning with practical examples.
现在,我们将在列表中再添加三个项目并进行讨论,并且还将通过实际示例来加强我们的学习。
- The disk activities of the query must be measured and analyzed 必须测量和分析查询的磁盘活动
- Avoid using non-sargable queries 避免使用不可持久查询
- Think twice before creating missing index suggestions of the execution plans 创建执行计划的缺失索引建议之前请三思
The main approach of query tuning must be to reduce the consumption of database resources. So that the execution time of the query will decrease or at least tuned query will consume minimum database resources.
查询调整的主要方法必须是减少数据库资源的消耗。 这样查询的执行时间将减少,或者至少调整查询将消耗最少的数据库资源。
One of the vital SQL Server resources can be counted as disk systems so it would be useful to obtain and analyze statistics about a performed query’s disk usage. In the next section, we will learn how to get statistics about a query’s disk activity.
SQL Server的重要资源之一可以视为磁盘系统,因此获取和分析有关已执行查询的磁盘使用情况的统计信息将非常有用。 在下一节中,我们将学习如何获取有关查询的磁盘活动的统计信息。
测量和分析磁盘活动 (Measure and analyze the disk activity)
If we want to succeed in SQL Server query tuning, we should have sufficient knowledge about some tools. STATISTICS IO report is one of the major tools, that helps to find out the disk activity statistics of the executed queries. When we enable this option, it displays the statistical disk activity report of a query. It has very simple syntax only, we need to enable it before executing the query.
如果我们想成功完成SQL Server查询调整,则应该对某些工具有足够的了解。 STATISTICS IO报告是主要工具之一,可帮助查找已执行查询的磁盘活动统计信息。 启用此选项后,它将显示查询的统计磁盘活动报告。 它只有非常简单的语法,我们需要在执行查询之前启用它。
Syntax:
句法:
SET STATISTICS IO { ON | OFF }
In the following query, we will enable the IO statistics and then execute the query. When we open the Messages tab, we can see the report output
在以下查询中,我们将启用IO统计信息,然后执行查询。 打开“ 消息”选项卡时,我们可以看到报告输出
SET STATISTICS IO ON
GO
SELECT * FROM Sales.vSalesPersonSalesByFiscalYears
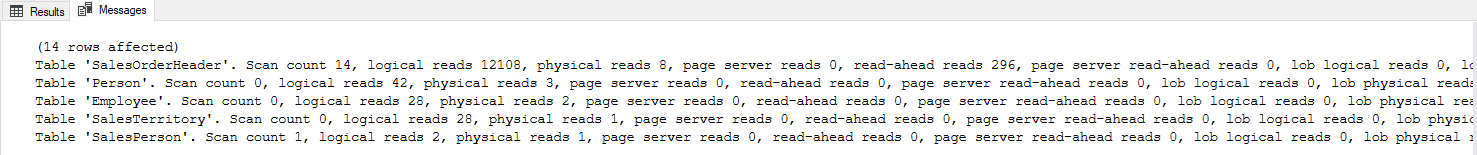
In this output, our eyes must first search the following measurement result because our goal should be to minimize these values.
在此输出中,我们的眼睛必须首先搜索以下测量结果,因为我们的目标应该是最小化这些值。
- Logical reads value indicates the number of pages reads from the cache逻辑读取值指示从缓存读取的页面数
- Physical reads value indicates the number of pages reads from the disk物理读取值指示从磁盘读取的页面数
However, this report output may seem a bit sophisticated and difficult to read. For this reason, we can use the Statistics Parser to transform this output more readable. On this web page, we just need to only paste the output of the report and click the Parse button.
但是,此报告输出似乎有些复杂且难以阅读。 由于这个原因,我们可以使用统计信息解析器来将此输出转换为更具可读性。 在此网页上,我们只需要粘贴报告的输出并单击“ 解析”按钮。
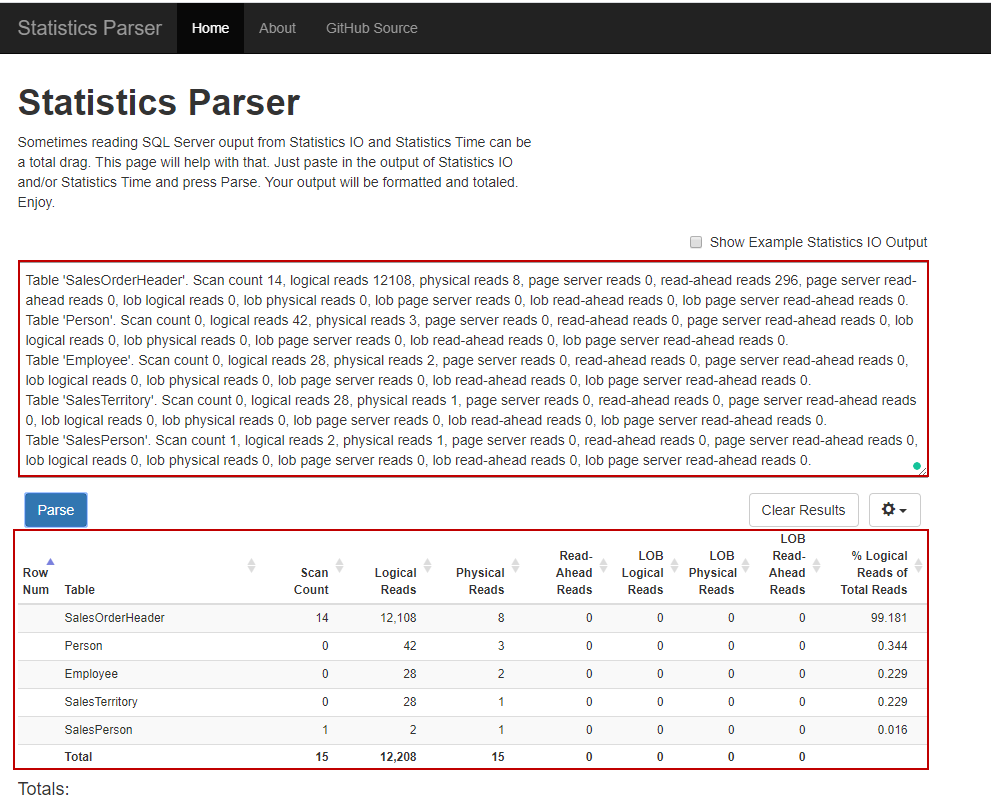
As we can see, we have obtained a well-formatted table report instead of the plain text report.
如我们所见,我们获得了格式良好的表格报告,而不是纯文本报告。
- Tip: The 提示:可能不会生成STATISTICS IO report might not be generatedSTATISTICS IO报告 for the 为了 memory-optimized tables. In the following example, we will create a very simple memory-optimized table 内存优化表。 在下面的示例中,我们将创建一个非常简单的内存优化表
CREATE TABLE dbo.SampleTable1 (
    Column1 INT IDENTITY(1,1) PRIMARY KEY NONCLUSTERED,
	    Column2 VARCHAR(100),
    Column3 VARCHAR(100),
 ) WITH (MEMORY_OPTIMIZED=ON ,DURABILITY=SCHEMA_AND_DATA)

GO
INSERT INTO SampleTable1 (Column2,Column3) VALUES('Column1Value','Column2Value')
INSERT INTO SampleTable1 (Column2,Column3) VALUES('Column1Value','Column2Value')
INSERT INTO SampleTable1 (Column2,Column3) VALUES('Column1Value','Column2Value')
Now we will enable the STATISTICS IO option and select the data of the memory-optimized table.
现在,我们将启用STATISTICS IO选项并选择内存优化表的数据。
SET STATISTICS IO ON
GO
SELECT * FROM SampleTable1
As a result, the STATISTICS IO has not generated a report for the memory-optimized tables.
结果, STATISTICS IO尚未为内存优化表生成报告。
STATISTICS TIME is another option to report execution time statistics of the query.
STATISTICS TIME是报告查询执行时间统计信息的另一个选项。
Syntax:
句法:
SET STATISTICS TIME { ON | OFF }
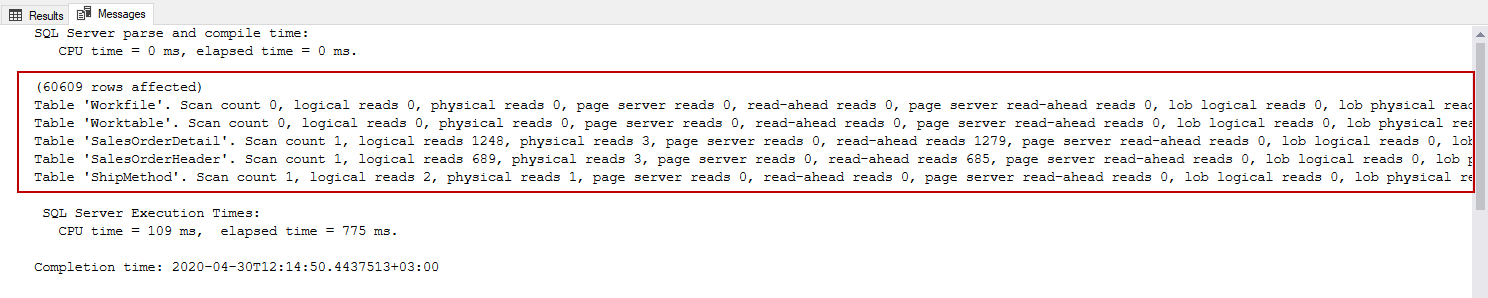
In the following query, we will enable the time statistics and then execute the query. When we open the Messages tab, we can see the output of the report.
在以下查询中,我们将启用时间统计信息,然后执行查询。 打开“消息”选项卡时,可以看到报告的输出。
SET STATISTICS TIME ON
GO
SELECT
    SalesDet.SalesOrderID,
    SalesOrderDetailID,
    CarrierTrackingNumber

    FROM
Sales.SalesOrderHeader SalesH
INNER JOIN Sales.SalesOrderDetail SalesDet ON SalesH.SalesOrderID = SalesDet.SalesOrderID
INNER JOIN Purchasing.ShipMethod ShipMethod ON ShipMethod.ShipMethodID = SalesH.ShipMethodID
WHERE ProductID < 999 AND ShipMethod.Name like 'CARGO%'
CPU time indicates the actual time that is consumed on CPU and elapsed time displays the total time taken for the completion of the query. At the same time, we can enable both IO and time statistics for the queries.
CPU时间表示在CPU上消耗的实际时间, 经过时间显示完成查询所花费的总时间。 同时,我们可以为查询启用IO和时间统计信息。
SET STATISTICS TIME, IO ON
GO
SELECT
   SalesDet.SalesOrderID,
   SalesOrderDetailID,
   CarrierTrackingNumber

   FROM
Sales.SalesOrderHeader SalesH
INNER JOIN Sales.SalesOrderDetail SalesDet ON SalesH.SalesOrderID = SalesDet.SalesOrderID
INNER JOIN Purchasing.ShipMethod ShipMethod ON ShipMethod.ShipMethodID = SalesH.ShipMethodID
WHERE ProductID < 999 AND ShipMethod.Name like 'CARGO%'
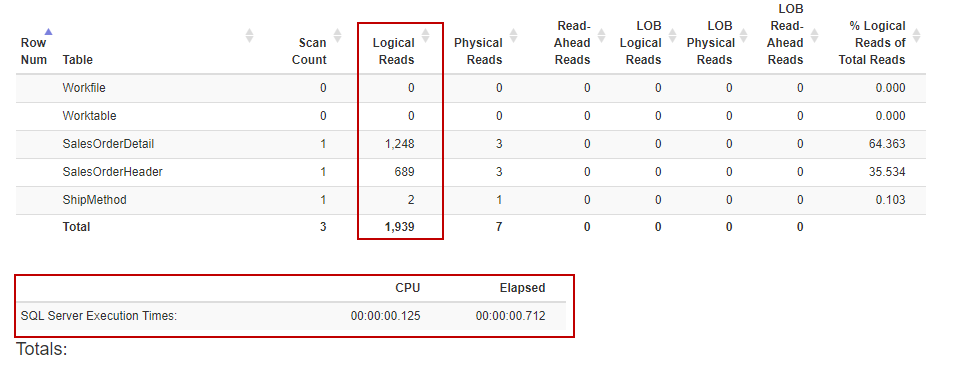
When we convert this output with Statistics Parser, we will obtain a more understandable report.
当使用Statistics Parser转换此输出时,我们将获得一个更易理解的报告。
避免使用不可持久查询 (Avoid using Non-sargable queries)
Non- Sargable queries can’t use indexes efficiently so these types of queries waste the database resources. Actually, tuning these queries is not very difficult.
不可保留的查询无法有效地使用索引,因此这些类型的查询会浪费数据库资源。 实际上,调整这些查询并不是很困难。
For example;
例如;
The following query retrieves the ProductNumber records which are the first two characters equals to ‘HN’ characters. With the help of the following query, we can retrieve this data.
以下查询检索ProductNumber记录,该记录的前两个字符等于“ HN ”字符。 借助以下查询,我们可以检索此数据。
SELECT ProductNumber FROM
Production.Product
WHERE SUBSTRING(ProductNumber,1,2 ) ='HN'
Let’s try to understand the execution plan of the above query.
让我们尝试了解上述查询的执行计划。
Clustered index scan operation reads index pages to find the matched records but it is not an effective way to retrieve the data. Now we will make a little change on the query and get rid of the SUBSTRING built-in function.
聚集索引扫描操作读取索引页以找到匹配的记录,但这不是检索数据的有效方法。 现在,我们将对查询进行一些更改,并摆脱SUBSTRING内置函数。
SELECT ProductNumber FROM
Production.Product
WHERE ProductNumber LIKE  'HN%'
After changing the query condition with the LIKE operator, the query optimizer has decided to use an index seek operator. Index seek operator directly reaches the matched records and it is more efficient than the index scan operation. Now we will compare the IO statistics of these two queries. The non-sargable query makes 1209 logical reads.
在使用LIKE运算符更改查询条件之后,查询优化器已决定使用索引查找运算符。 索引查找运算符直接到达匹配的记录,并且比索引扫描操作更有效。 现在,我们将比较这两个查询的IO统计信息。 不可查询将进行1209次逻辑读取。
On the other hand, the sargable query reads 58 logical pages.
另一方面,可查询查询读取58个逻辑页。
Using the sargable queries can be a good option for the SQL Server query tuning.
对于SQL Server查询调整,使用可保留查询可能是一个不错的选择。
- You can see the How to use sargable expressions in T-SQL queries; performance advantages and examples article to improve your skills about the sargable queries
- 您可以在T-SQL查询中看到如何使用可扩展表达式。 性能优势和示例文章,以提高您关于可查询查询的技能
创建丢失的索引前请三思 (Think twice before creating missing indexes)
The execution plan is the most commonly used tool to understand the sequenced operation steps of the query and it is a vital helper tool for query tuning.
执行计划是了解查询的顺序操作步骤的最常用工具,并且是查询调优的重要帮助工具。
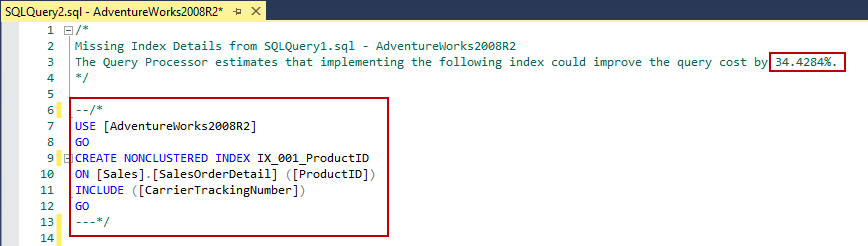
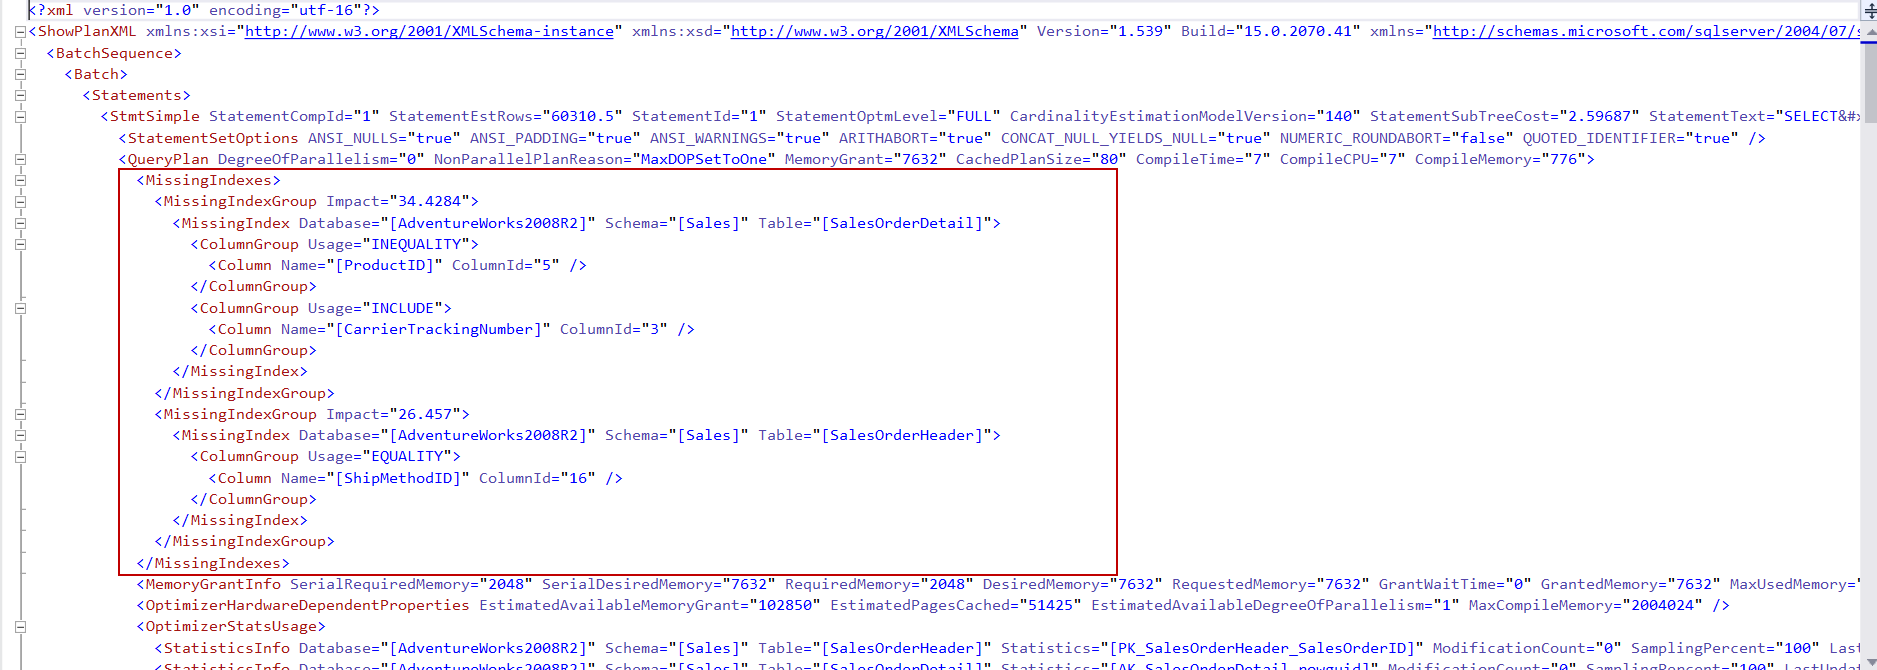
Sometimes execution plans of the queries suggest indexes for the executed queries. These missing index details are showed a green color text shows on the top of the execution plan. This index suggestion also displays the performance impact of the query when we create this index. The following image illustrates an example of the missing index that is generated by the execution plan.
有时查询的执行计划会建议已执行查询的索引。 这些缺失的索引详细信息在执行计划的顶部显示为绿色文本。 创建我们的索引时,该索引建议还显示查询对性能的影响。 下图说明了执行计划生成的缺少索引的示例。
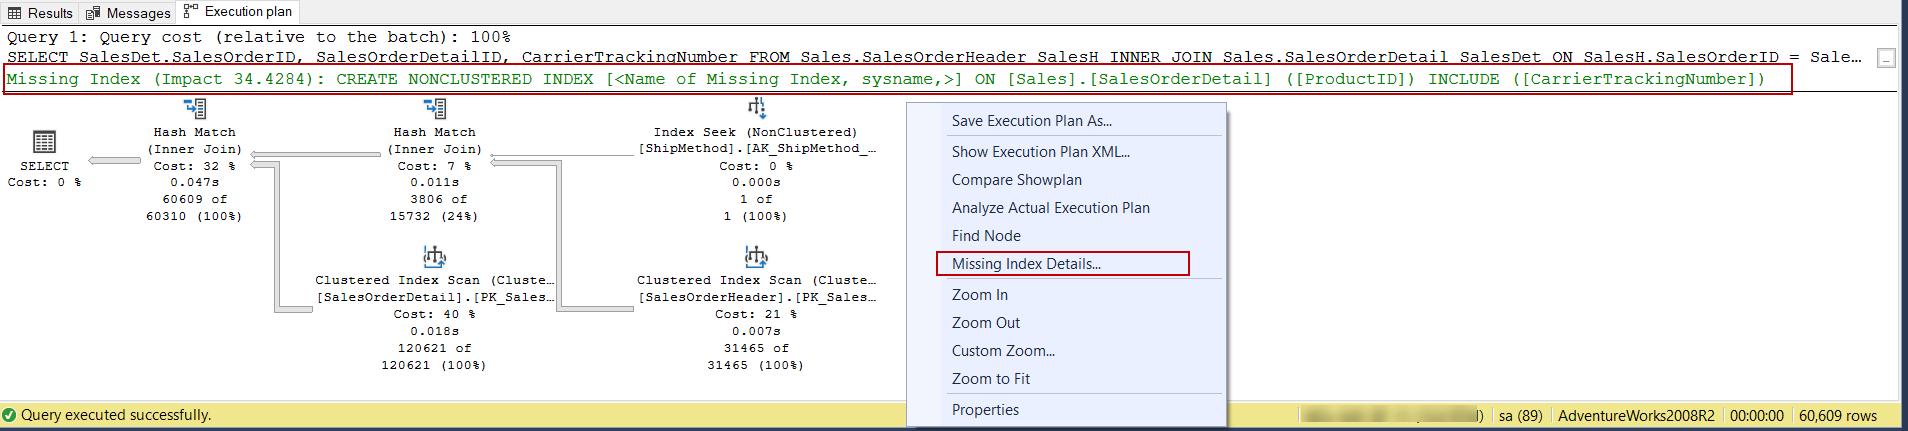
When we click over the missing index, the index creation script will appear in another query window and we can give a name to this index and can create it.
当我们单击丢失的索引时,索引创建脚本将出现在另一个查询窗口中,我们可以给该索引命名并创建它。
However, before creating missing indexes we should think twice:
但是,在创建丢失的索引之前,我们应该三思:
- Before creating the missing index, we have to consider the workload of the data manipulation queries (INSERT, UPDATE, or DELETE). Otherwise, we may observe a decrease in the performance of these queries 在创建丢失的索引之前,我们必须考虑数据操作查询(INSERT,UPDATE或DELETE)的工作量。 否则,我们可能会发现这些查询的性能下降
- By adding new included columns or index key columns, previous directories may be eligible for the executed query 通过添加新的包含列或索引键列,以前的目录可能符合执行的查询的条件
- Make sure that the executed query will not be used only several times 确保执行的查询不会多次使用
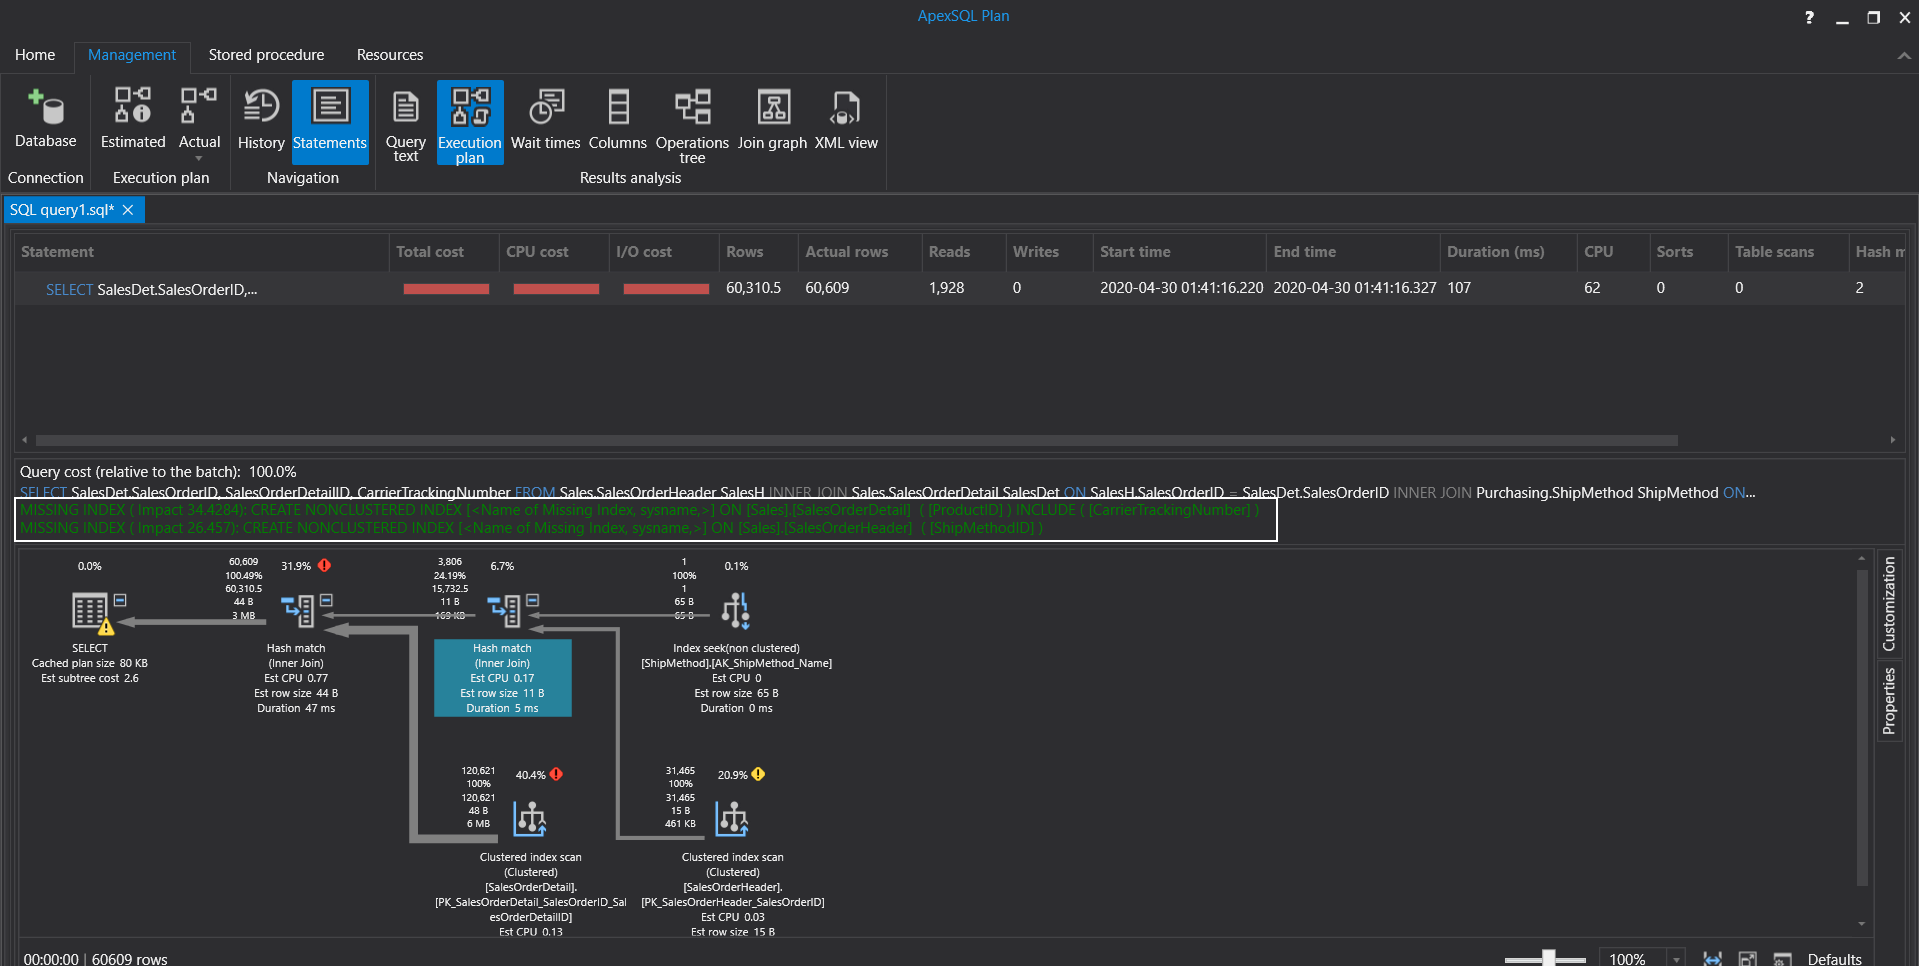
On the other hand, SSMS visual execution plan only displays a single missing index but when we analyze the execution plan details, we can face a surprise about this issue. Now we will enable the actual execution plan and execute the following query.
另一方面,SSMS视觉执行计划仅显示一个缺失的索引,但是当我们分析执行计划的详细信息时,我们可能会对此感到惊讶。 现在,我们将启用实际的执行计划并执行以下查询。
SELECT
	SalesDet.SalesOrderID,
	SalesOrderDetailID,
	CarrierTrackingNumber

	FROM
Sales.SalesOrderHeader SalesH
INNER JOIN Sales.SalesOrderDetail SalesDet ON SalesH.SalesOrderID = SalesDet.SalesOrderID
INNER JOIN Purchasing.ShipMethod ShipMethod ON ShipMethod.ShipMethodID = SalesH.ShipMethodID
WHERE ProductID < 999 AND ShipMethod.Name like 'CARGO%'
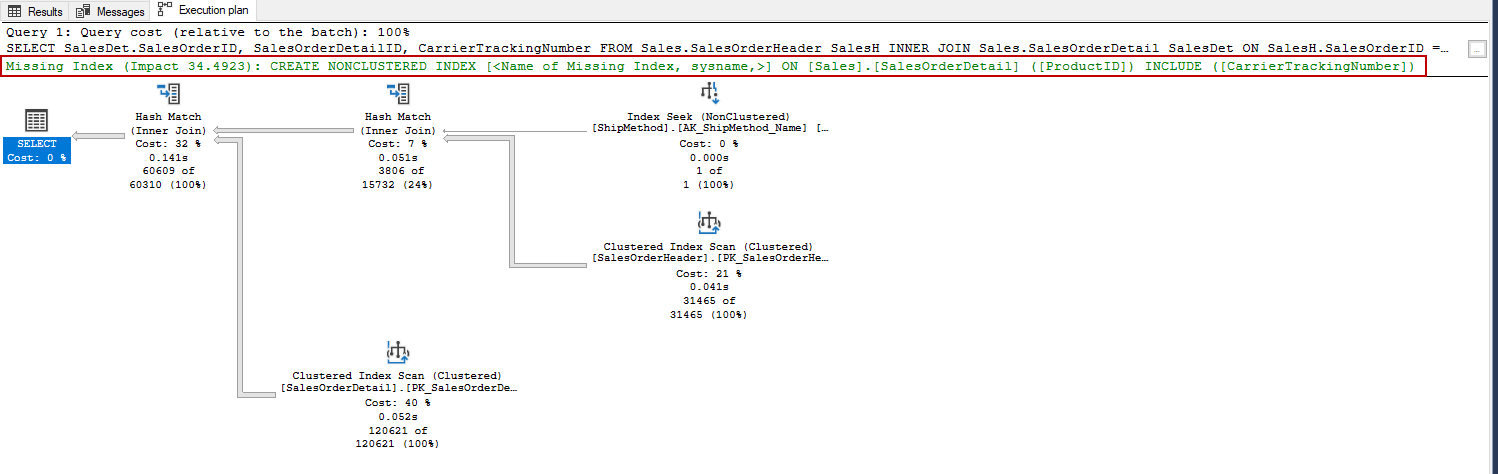
As we can see, SQL Server Management Studio only displays a single missing index suggestion. However, when we right-click on the SELECT operator and select the Properties menu and look at the MissingIndex property option, we will find out more than one missing index suggestion.
如我们所见,SQL Server Management Studio仅显示一个缺少索引的建议。 但是,当我们右键单击SELECT运算符并选择“ 属性”菜单并查看MissingIndex属性选项时,我们将发现多个缺失的索引建议。
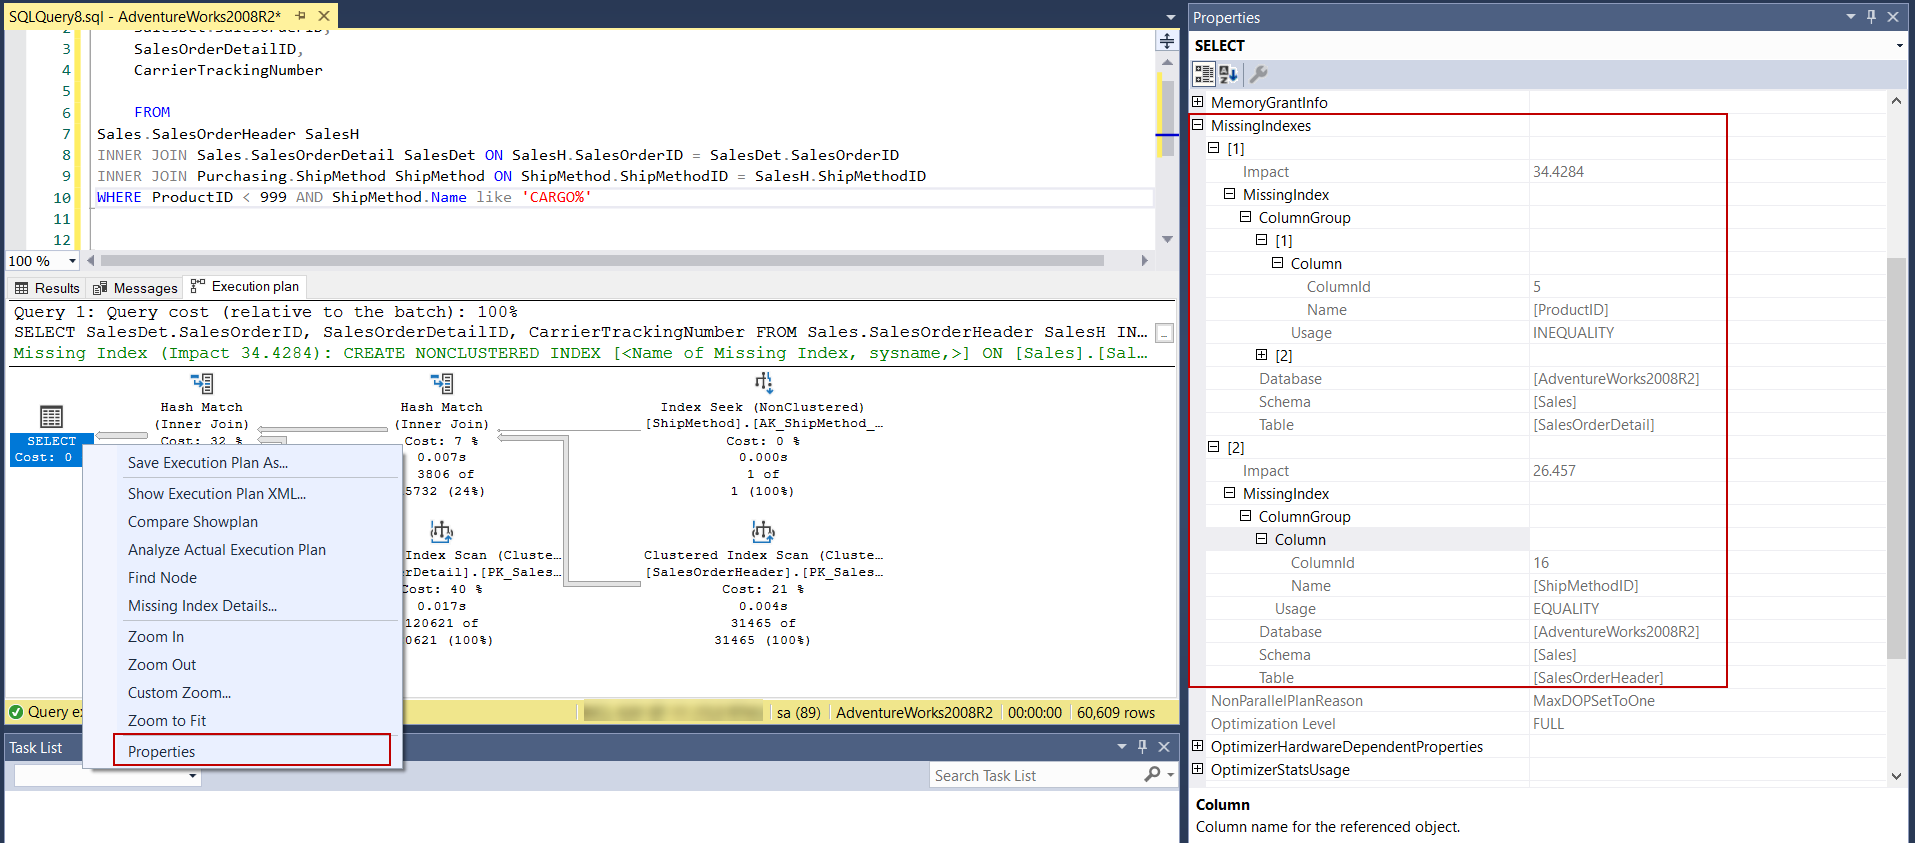
As a result, we should check missing index details of the last operator of the execution plan if any index suggestion is available. Also unlike visual representation of the execution plan, Plan XML can display multiple index suggestions.
因此,如果有任何索引建议可用,我们应该检查执行计划中最后一个运算符的缺失索引详细信息。 另外,与执行计划的视觉表示不同, 计划XML可以显示多个索引建议。
We can use the ApexSQL Plan instead of using SQL Server Management Studio (SSMS) execution plans because ApexSQL Plan displays reliable results about the missing index suggestions. When we execute the same query on the ApexSQL Plan and it displays 2 separated missing indexes.
我们可以使用ApexSQL计划而不是使用SQL Server Management Studio(SSMS)执行计划,因为ApexSQL计划显示有关缺少索引建议的可靠结果。 当我们在ApexSQL计划上执行相同的查询时,它显示2个分离的缺失索引。
结论 (Conclusion)
In this article, we learned 3 essential techniques that help to tune query performance. SQL Server query tuning is a very compelling issue and every different query requires different tune approaches but some outlines never change and with this article we learned these essential methods.
在本文中,我们学习了三种有助于调整查询性能的基本技术。 SQL Server查询调优是一个非常引人注目的问题,每个不同的查询都需要不同的调优方法,但是某些概述从未改变,因此,通过本文,我们了解了这些基本方法。
翻译自: https://www.sqlshack.com/sql-server-query-tuning-tips-for-beginners-with-practical-examples/
sql查询初学者指南


 829
829


 被折叠的 条评论
为什么被折叠?
被折叠的 条评论
为什么被折叠?
 到【灌水乐园】发言


