


 本文详细介绍了如何监视SQL Server内存数据库,包括使用SMSS标准报告、T-SQL以及内部结构组件的内存消耗。还讨论了内存优化检查点模式、实例级别的XTPSupported检查以及如何监视内存容器。
We can use a variety of available options to keep systems performing at their very best. The SQL Server In-Memory OLTP technological advancement is a great innovation to relieve tempdb contentions. This feature is available with an additional advantage to monitor systems without incurring stress on the database servers.
我们可以使用各种可用选项来使系统保持最佳性能。 SQL Server内存中OLTP技术的进步是减轻tempdb争用的一项伟大创新。 此功能具有附加优势,可以监视系统而又不会对数据库服务器造成压力。
This article details:
本文详细介绍:
- The use of the SMSS standard report to get a quick view of the available resources 使用SMSS标准报告快速查看可用资源
- How T-SQL can be used to monitor SQL Server In-Memory databases 如何使用T-SQL监视SQL Server内存数据库
- Details the internal structure of memory consumers 详细说明内存使用者的内部结构
- Drive space management within the SQL Server using DMFs 使用DMF在SQL Server中进行空间管理
- Monitor In-Memory Containers from within SQL Server 从SQL Server监视内存中的容器
- How to get the details of In-Memory checkpoint mode 如何获取内存中检查点模式的详细信息
- The determination of used/free space within the In-Memory database 确定内存数据库中的已用/可用空间
- And more… 和更多…
介绍 (Introduction)
As technology advances and the landscape shifts the relational database transactions from non-volatile to volatile spaces, the complexity of database monitoring and maintenance become more intense (and sometimes, tedious). This makes database monitoring and the evaluation of database metrics important. The purpose of monitoring and evaluation is to track the implementation and outputs systematically and measure the effectiveness of the standards, in order to determine exactly what change is needed and when.
随着技术的发展和格局的变化,关系数据库事务已从非易失性空间转变为易失性空间,数据库监视和维护的复杂性变得更加强烈(有时是乏味的)。 这使得数据库监视和数据库指标评估很重要。 监视和评估的目的是系统地跟踪实施和输出,并衡量标准的有效性,以便准确确定需要进行哪些更改以及何时进行更改。
入门 (Getting Started)
Let us see how the SSMS Standard Report can be used to get high-level details of SQL Server in-memory objects. The standard SSMS report, “Memory Usage by Memory Optimized Objects” shows the memory usage details of SQL Server In-Memory optimized objects.
让我们看看如何使用SSMS标准报告获取SQL Server内存对象的高级详细信息。 标准的SSMS报告“内存优化对象的内存使用情况”显示了SQL Server内存优化对象的内存使用情况详细信息。
To view the Memory Usage by Memory Optimized Objects report:
要查看“内存优化对象的内存使用情况”报告:
- Object Explorer, connect to an instance of the SQL Server Database Engine and then expand that instance. 对象资源管理器”中 ,连接到SQL Server数据库引擎的实例,然后展开该实例。
- Databases, and then click 数据库” ,然后单击Reports “报告”。
- Select Memory Usage By Memory Optimized Objects
- 通过内存优化对象选择内存使用率
The three sections of the Memory Usage by Memory Optimized Objects are listed below
下面列出了内存优化对象的内存使用情况的三个部分:
Using the DMV sys.dm_db_xtp_table_memory_stats we can derive the total memory allocated to Memory Optimized objects.
使用DMV sys.dm_db_xtp_table_memory_stats,我们可以得出分配给“内存优化”对象的总内存。
The Below SQL generates the output which can also be generated from the SSMS reports.
下面SQL生成的输出也可以从SSMS报告中生成。
IF
(
    SELECT COUNT(1)
    FROM sys.data_spaces
    WHERE type = 'FX'
) > 0
    BEGIN
        SELECT SUM([Total used Memory MB] + [Total Unused Memory MB] + [Index used Memory MB] + [Index Unused Memory MB]) [Total memory allocated to memory optimized objects MB]
        FROM
        (
            SELECT OBJECT_NAME(object_id) AS tblName,
                   CAST(memory_used_by_table_kb / 1024.00 AS DECIMAL(10, 2)) [Total used Memory MB],
                   CAST(memory_allocated_for_table_kb / 1024.00 AS DECIMAL(10, 2)) - CAST(memory_used_by_table_kb / 1024.00 AS DECIMAL(10, 2)) [Total Unused Memory MB],
                   CAST(memory_used_by_indexes_kb / 1024.00 AS DECIMAL(10, 2)) [Index used Memory MB],
                   CAST(memory_allocated_for_indexes_kb / 1024.00 AS DECIMAL(10, 2)) - CAST(memory_used_by_indexes_kb / 1024.00 AS DECIMAL(10, 2)) [Index Unused Memory MB]
            FROM sys.dm_db_xtp_table_memory_stats
        ) T;
    END;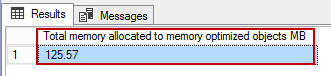
Memory usage details of SQL Server In-Memory tables
SQL Server内存表的内存使用情况详细信息
We can also use the related DMV sys.dm_db_xtp_table_memory_stats to draw the sizing details of the memory optimized tables.
我们还可以使用相关的DMV sys.dm_db_xtp_table_memory_stats来绘制内存优化表的大小详细信息。
IF
(
    SELECT COUNT(1)
    FROM sys.data_spaces
    WHERE type = 'FX'
) > 0
    BEGIN
        SELECT OBJECT_NAME(object_id) AS tblName,
               CAST(memory_used_by_table_kb / 1024.00 AS DECIMAL(10, 2)) [Total used Memory MB],
               CAST(memory_allocated_for_table_kb / 1024.00 AS DECIMAL(10, 2)) - CAST(memory_used_by_table_kb / 1024.00 AS DECIMAL(10, 2)) [Total Unused Memory MB],
               CAST(memory_used_by_indexes_kb / 1024.00 AS DECIMAL(10, 2)) [Index used Memory MB],
               CAST(memory_allocated_for_indexes_kb / 1024.00 AS DECIMAL(10, 2)) - CAST(memory_used_by_indexes_kb / 1024.00 AS DECIMAL(10, 2)) [Index Unused Memory MB]
        FROM sys.dm_db_xtp_table_memory_stats;
    END;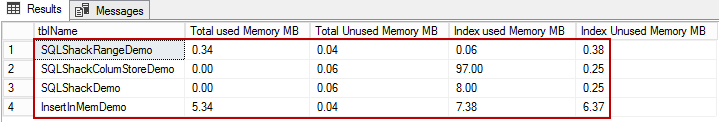
内部系统结构组件的内存消耗 (Memory consumption by internal system structure components)
To see the total memory consumed by system allocators, use the following query:
要查看系统分配器消耗的总内存,请使用以下查询:
SELECT SUM(allocated_bytes) / (1024 * 1024) AS total_allocated_MB,
       SUM(used_bytes) / (1024 * 1024) AS total_used_MB
FROM sys.dm_xtp_system_memory_consumers;
Next, let us take a look at the different memory consumer types.
接下来,让我们看一下不同的内存使用者类型。
SELECT memory_consumer_type,
       memory_consumer_type_desc,
       allocated_bytes / 1024 [allocated_bytes_kb],
       used_bytes / 1024 [used_bytes_kb],
       allocation_count
FROM sys.dm_xtp_system_memory_consumers;
In the following output, we can see there are a few memory LOOKASIDE consumers.
在以下输出中,我们可以看到有一些LOOKASIDE内存。
Note: A lookaside consumer is part of MMU (Memory Management Unit) and it’s a type of buffer cache used to reduce the time taken to access the memory location of each transactions.
注意:后备使用者是MMU(内存管理单元)的一部分,它是一种缓冲区高速缓存,用于减少访问每个事务的内存位置所花费的时间。
To see the memory consumption at run-time when accessing SQL Server In-Memory optimized tables, use the following query
若要在访问SQL Server内存中优化表时查看运行时的内存消耗,请使用以下查询
SELECT type clerk_type,
       name,
       memory_node_id,
       pages_kb / 1024 pages_mb
FROM sys.dm_os_memory_clerks
WHERE type LIKE '%xtp%';
Property | DataType | Description |
name | nvarchar(256) | Specifies the internally assigned name of this memory clerk. A component can have several memory clerks of a specific type. A component might choose to use specific names to identify memory clerks of the same type. It’s a not nullable column. |
memory_node_id | smallint | It returns the ID of the memory node. It is also a not nullable field. |
pages_kb | bigint | Applies to: SQL Server 2012 through SQL Server 2017. |
Specifies the amount of page memory allocated in kilobytes (KB) for this memory clerk. It’s not nullable column |
属性 | 数据类型 | 描述 |
名称 | nvarchar(256) | 指定此内存职员的内部分配名称。 一个组件可以具有多个特定类型的存储文员。 组件可能选择使用特定名称来标识相同类型的内存文员。 这是一个不可为空的列。 |
memory_node_id | Smallint | 它返回内存节点的ID。 这也是一个不可为空的字段。 |
pages_kb | 比金特 | 适用于 :SQL Server 2012到SQL Server 2017。 |
指定为此内存管理员分配的页面内存量(以千字节(KB)为单位)。 它不是可为空的列 |
The output shows that the databases ID 13 reserve a 173 KB in the memory.
输出显示数据库ID 13在内存中保留了173 KB。
Now, let’s see what are the other components of SQL Server using the memory internally using sys.dm_os_memory_clerks this will give you the overview of active components of memory clerks within SQL Server.
现在,让我们使用sys.dm_os_memory_clerks内部查看内存中SQL Server的其他组件是什么,这将为您提供SQL Server中内存文员的活动组件的概述。
SELECT TOP (10) type MemoryClerkType,
                SUM(pages_kb) / 1024 AS SizeMB
FROM sys.dm_os_memory_clerks
GROUP BY type
ORDER BY 2 DESC;
SQL Server内存优化的检查点模式 (SQL Server In-Memory optimized checkpoint mode)
To get details of SQL Server In-Memory check point mode of a SQL instance from the Error log, run the following query that will list the memory optimized Checkpoint Mode of an SQL instance
若要从错误日志中获取SQL实例SQL Server内存中检查点模式的详细信息,请运行以下查询,该查询将列出SQL实例的内存优化检查点模式
EXEC sys.xp_readerrorlog 0, 1, N'In-Memory OLTP initialized on';
The output can list any of the three possible values
输出可以列出三个可能的值中的任何一个
- In-Memory OLTP initialized on low-end machine 在低端计算机上初始化内存中OLTP
- In-Memory OLTP initialized on standard machine 在标准计算机上初始化内存中OLTP
- In-Memory OLTP initialized on high-end machine (Large Checkpoint mode) 在高端计算机上初始化了内存中OLTP(大型Checkpoint模式)
The aforementioned query, xp_readerrorlog, reads the SQL Server error log file. During the start up the SQL Server is going to figure out whether or not the system is using large checkpoints. When there is a restart, every time, SQL Server starts up, it checks for the system configuration and specifications, and it also quickly measure how can it read the SQL Server In-Memory OLTP checkpoint file. So when I run the query, it gives me a text message stating it is initialized on a low-end machine, and the reason for that is because I have system configured with a very less resources.
前述查询xp_readerrorlog读取SQL Server错误日志文件。 在启动过程中,SQL Server将确定系统是否使用大型检查点。 重新启动后,每次SQL Server都会启动,它会检查系统配置和规格,还可以快速测量如何读取SQL Server内存中OLTP检查点文件。 因此,当我运行查询时,它会给我一条文本消息,指出它是在低端计算机上初始化的,其原因是因为我的系统配置了很少的资源。
Note: The trace flag 9912 enabled to get the system configured to use large checkpoint mode. In any of the case it is advised to measure a performance that suits better with your workload.
注意:启用跟踪标志9912可以将系统配置为使用大型检查点模式。 在任何情况下,都建议对性能进行评估,使其更适合您的工作负载。
If the output shows SQL Server In-Memory OLTP initialized on a high-end machine, then it must satisfy the following mandatory points
如果输出显示在高端计算机上初始化SQL Server内存中OLTP,则它必须满足以下强制性要点
- The server must has 16 or more logical processors 服务器必须具有16个或更多逻辑处理器
- It must be configured with 128GB or more memory 必须配置128GB或更多内存
- High transaction rate systems that is >200 MB/Sec IO. 高事务速率系统,> 200 MB /秒IO。
Note:
注意:
- SQL Server 2016 CU1 and/or later, global trace lag 9912 must be enabled to get large checkpoint mode. SQL Server 2016 CU1和/或更高版本,必须启用全局跟踪滞后9912,才能获取大型检查点模式。
- The large checkpoints are designed for high throughput and high transaction rate systems. 大型检查点设计用于高吞吐量和高事务处理率的系统。
- If any one or two of the aforementioned statements are true, then the output will display “ In-Memory OLTP initialized on standard machine” 如果上述任何一个或两个语句为真,则输出将显示“在标准计算机上初始化的内存中OLTP”
- If all of the three statement are true then the SQL instance is configured with “In-Memory OLTP initialized on high-end machine” 如果这三个语句都为真,则将SQL实例配置为“在高端计算机上初始化的内存中OLTP”
- If none of the three statement are holds good, then it returns the output “In-Memory OLTP initialized on low-end machine” 如果这三个语句中的任何一个都不成立,则返回输出“在低端计算机上初始化的内存中OLTP”
如何在实例级别检查XTPSupported (How to check XTPSupported at the instance level)
The useful information about your instance can be seen by running the following query. It uses SERVERPROPERTY, a built-in function to list the property.
通过运行以下查询,可以查看有关实例的有用信息。 它使用SERVERPROPERTY(一个内置函数来列出属性)。
SELECT SERVERPROPERTY('IsXTPSupported') AS [IsXTPSupported]
监视SQL Server内存容器 (Monitor a SQL Server In-Memory container)
The DMV sys.dm_db_xtp_checkpoint_files provides information about checkpoint file pairs in the database, using two types of files: the data file and the delta file. The data file stores the inserted records, while the delta stores the removed records. These records are merged over time, using garbage collection principles. To see each of the files with details, use the sys.dm_db_xtp_checkpoint_files extended store procedure.
DMV sys.dm_db_xtp_checkpoint_files使用两种文件类型提供有关数据库中检查点文件对的信息:数据文件和增量文件。 数据文件存储插入的记录,而增量存储删除的记录。 这些记录将使用垃圾回收原理随时间合并。 要查看每个文件的详细信息,请使用sys.dm_db_xtp_checkpoint_files扩展存储过程。
sp_spaceused – sp_spaceused can now be used to understand the storage footprint associated with SQL Server In-Memory OLTP. A new parameter, ‘@include_total_xtp_storage’, has been added to the stored procedure to get the relevant data.
sp_spaceused – sp_spaceused现在可用于了解与SQL Server内存OLTP相关的存储占用空间。 已将一个新参数'@include_total_xtp_storage'添加到存储过程中以获得相关数据。
USE SQLShackInMemDB;
GO
EXEC sp_spaceused
     @updateusage = 'FALSE',
     @mode = 'ALL',
     @oneresultset = '1',
     @include_total_xtp_storage = '1';
GO

xtp_precreated, xtp_used and xtp_pending_truncation are based on the state of the checkpoint file pairs. These pointers give information about the requirement of database backup initiated or not. This is how the XTP columns are derived in the sp_spaceused output.
xtp_precreated,xtp_used和xtp_pending_truncation基于检查点文件对的状态。 这些指针提供有关是否启动数据库备份的要求的信息。 这就是在sp_spaceused输出中派生XTP列的方式。
摘要 (Summary)
In this article, we’ve we covered a number of useful SQL Server in-memory queries, and how to interpret the results of those queries. I will discuss more about drive space used by memory containers and XTP performance counters in my next article. I hope you will like this article. Feel free to leave the feedback below in the comment section.
在本文中,我们介绍了许多有用SQL Server内存中查询以及如何解释这些查询的结果。 我将在下一篇文章中讨论有关内存容器和XTP性能计数器使用的驱动器空间的更多信息。 希望您喜欢这篇文章。 请随时在下面的评论部分中留下反馈。
目录 (Table of contents)
| SQL Server In-Memory database internal memory structure monitoring |
| How to monitor internal data structures of SQL Server In-Memory database objects |
| SQL Server内存数据库内部内存结构监视 |
| 如何监视SQL Server内存数据库对象的内部数据结构 |
翻译自: https://www.sqlshack.com/sql-server-in-memory-database-internal-memory-structure-monitoring/


 1835
1835

 被折叠的 条评论
为什么被折叠?
被折叠的 条评论
为什么被折叠?
 到【灌水乐园】发言


