


power bi 地图
该项目 (The project)
This is the first article of a series dedicated to discovering geographic maps in Power BI using Bubble Map and Filled Map.
这是致力于使用Bubble Map和Filled Map在Power BI中发现地理地图的系列文章的第一篇。
My goal is to illustrate to you the different visuals available in Power BI for making maps. Remember that Power BI is a product undergoing constant evolution; new features are added every month at a fast pace. And over time Power BI has gained more mapping capabilities compared to the starting point.
我的目标是向您说明Power BI中用于制作地图的各种视觉效果。 请记住,Power BI是一个不断发展的产品。 每月都会快速添加新功能。 随着时间的推移,与起点相比,Power BI获得了更多的映射功能。
So I believe that it could be useful to make some order and give a complete overview of what the tool has now to offer. I’m going to show you each component, its features and the right way to achieve the correct result.
因此,我认为定购订单并全面概述该工具现在提供的功能可能会很有用。 我将向您展示每个组件,其功能以及获得正确结果的正确方法。
At the end of the series, you’ll have a clear understanding of how you can create maps in Power BI and which it the best visual to use according to your needs.
在本系列的最后,您将清楚地了解如何在Power BI中创建地图以及根据您的需求使用哪种最佳视觉效果。
After introducing the project, let’s start with the first topic.
介绍项目之后,让我们从第一个主题开始。
气泡图 (Bubble maps)
Bubble maps and filled maps are the primitive visuals introduced since the first release of Power BI. They are based on the Bing map engine. Bing simply recognizes addresses, coordinates or any geographic attribute and plots it on a map. Behind the scenes, Bing converts the input into geographic coordinates (latitude and longitude) to be passed to the page. A well-known process called geocoding.
气泡图和填充图是自Power BI首次发布以来引入的原始视觉效果。 它们基于必应地图引擎。 必应仅识别地址,坐标或任何地理属性,并将其绘制在地图上。 Bing在幕后将输入转换为地理坐标(纬度和经度),以传递到页面。 一个著名的过程,称为geocoding 。
Bubble map and filled maps allow interactivity between objects in your report; highlighting a location in the map, applies a filter the other tiles on the report page and vice versa.
气泡图和填充图允许报表中的对象之间进行交互。 突出显示地图中的位置,然后对报告页面上的其他图块应用过滤器,反之亦然。
Power BI is capable of accepting most of the relevant location value we can pass; addresses, cities, zip codes, countries, airports, etc. Nevertheless, it’s advisable to follow some “best practices” in order to get a valid result. I’ll go more in detail later on.
Power BI能够接受我们可以传递的大多数相关位置值; 地址,城市,邮政编码,国家/地区,机场等。尽管如此,建议您遵循一些“最佳做法”以获取有效的结果。 我将在后面详细介绍。
To be immediately aware of how bubble map work, let’s try a simple test; open a new report in Power BI Desktop and click Enter Data.
为了立即了解气泡图的工作原理,让我们尝试一个简单的测试。 在Power BI Desktop中打开一个新报告,然后单击Enter Data 。
In the pop-up window you can enter values manually to create a table. Enter the data as shown in the picture below. Call the column Address, call the table bing_test and click Load.
在弹出窗口中,您可以手动输入值以创建表。 输入数据,如下图所示。 调用地址列,调用表bing_test并单击加载 。
Now drag the bubble map symbol
现在拖动气泡图符号
Into the Location box put Address from the bing_test table. You get the following result:
将“ bing_test”表中的“ 地址”放入“ 位置”框中。 您得到以下结果:
The Bing engine is clever enough to identify locations although of a different kind; two addresses, a bridge, an airport, a volcano (!). But it didn’t recognize a building, Teatro San Carlo a theater in Naples and placed the point somewhere else. We will address the issue later on.
Bing引擎非常聪明,可以识别位置,尽管类型不同。 两个地址,一座桥,一座机场,一座火山(!)。 但是它没有认出建筑物,那不勒斯剧院是圣卡洛剧院,把重点放在了其他地方。 我们稍后会解决这个问题。
For a complete demo of bubble map, I want to use some airports data collected from Openflights.org a free database with airports and airlines data. Click here, to download the full dataset with over 12000 rows of data. Download the file in either .dat or .csv format.
对于气泡图的完整演示,我想使用从Openflights.org收集的一些机场数据, 其中包含机场和航空公司数据的免费数据库。 单击此处 ,下载包含12000多行数据的完整数据集。 以.dat或.csv格式下载文件。
Alternatively, I prepared a smaller .csv dataset with the 50 world’s busiest airports that you can find at the end of the article, accompanied by the .pbix created for the demo.
另外,我准备了一个较小的.csv数据集,其中包含您可以在本文结尾处找到的50个世界上最繁忙的机场,以及为该演示创建的.pbix。
After downloading, open Power BI Desktop and create a new empty report. Click Get Data -> Text/CSV.
下载后,打开Power BI Desktop并创建一个新的空报告。 单击获取数据 -> 文本/ CSV 。
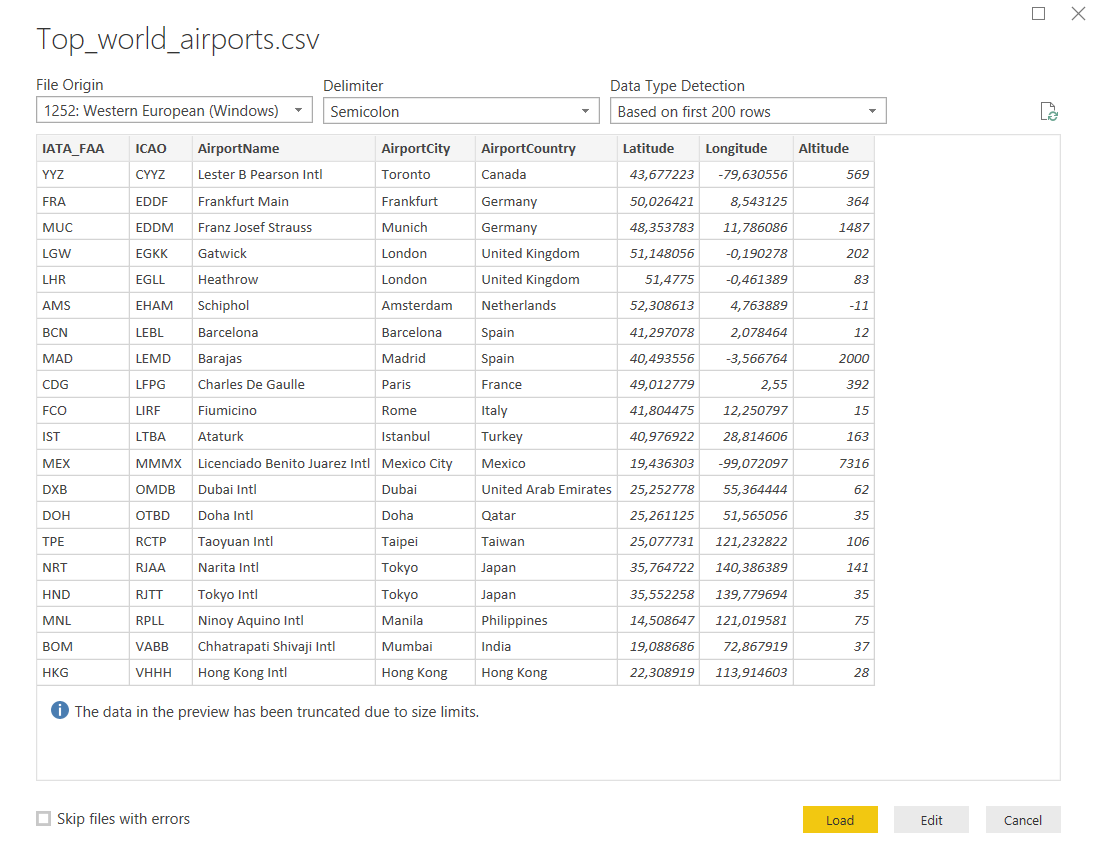
Click Connect and choose the location of your file. Power BI loads the file and shows you a data preview, based on file code page and delimiter.
单击“ 连接”,然后选择文件的位置。 Power BI将基于文件代码页和定界符加载文件并向您显示数据预览。
 最低0.47元/天 解锁文章


 3437
3437


 被折叠的 条评论
为什么被折叠?
被折叠的 条评论
为什么被折叠?
 到【灌水乐园】发言


