


 本文介绍了如何在SQL Server 2016 Reporting Services中创建和配置树形图,以显示大量层次结构数据。文章通过与森伯斯特图的比较,展示了树形图在呈现数据时的优势,并提供了创建树形图的步骤,包括数据导入、图表创建和自定义。最后,文章讨论了两者在显示层次结构数据方面的优劣。
In the previous article, in this series, How to create and configure a Sunburst chart in SQL Server 2016 Reporting Services, we have explored new chart types in SQL Server 2016; the Sunburst chart and the Tree Map chart, that are used to display hierarchical data. The Sunburst chart is a way of presenting relational datasets together in a compact form. The Tree Map Chart is also a way of showing hierarchical data.
在本系列的上一篇文章“ 如何在SQL Server 2016 Reporting Services中创建和配置Sunburst图表”中 ,我们在SQL Server 2016中探索了新的图表类型;本文的主题是“ 如何在SQL Server 2016 Reporting Services中创建Sunburst图表” 。 Sunburst图表和Tree Map图表,用于显示层次结构数据。 Sunburst图表是一种以紧凑的形式一起显示关系数据集的方法。 树形图也是一种显示层次结构数据的方法。
In this article, we are going to show how to create a Tree Map chart and its comparison with the Sunburst chart.
在本文中,我们将展示如何创建树图和与森伯斯特图的比较。
树状图 (The Tree Map chart)
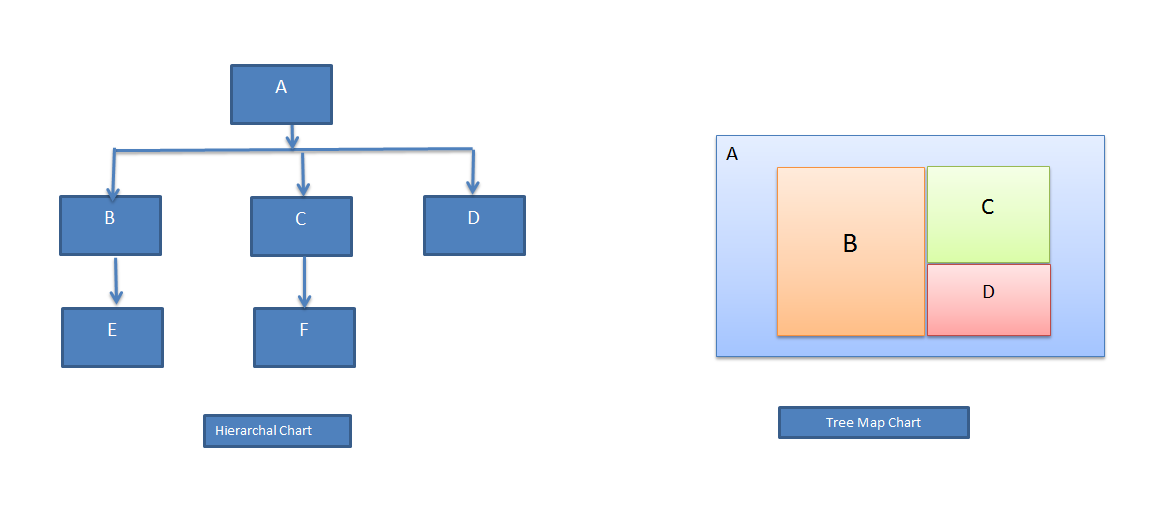
The Tree Map chart is a good way for displaying large amounts of hierarchically structured data. It shows hierarchical data into a number of rectangles. The tree Map Chart consists of different groups, and each group contains further rectangles These rectangles are of different size depending upon the data. These boxes are placed from left to right in order of large to small values.
树状图是显示大量层次结构化数据的好方法。 它将分层数据显示为多个矩形。 树形地图由不同的组组成,每个组还包含其他矩形。这些矩形的大小取决于数据。 这些框按从大到小的顺序从左到右放置。
Below is the architecture diagram of a Tree Map chart.
下面是树形图的体系结构图。
样本数据 (Sample Data)
In this article, we are going to use Olympic Games medal tally as the sample data. It includes top six countries medals data. The data is further divided into sports category.
在本文中,我们将使用奥运会奖牌统计作为样本数据。 它包括前六名国家的奖牌数据。 数据进一步分为运动类别。
We have prepared the data using Excel sheet to create the SSRS report we need to import that data first into the sample database.
我们已经使用Excel工作表准备了数据以创建SSRS报告,我们需要首先将该数据导入示例数据库。
You can find the Excel sheet in the attachment section.
您可以在附件部分找到Excel工作表。
To import data into a database, we need to Right click on the database and click import data
要将数据导入数据库,我们需要右键单击数据库,然后单击导入数据
We’ll select the data source as Microsoft Excel and give the Excel file path. In our Excel sheet, the first row has column names so we will choose the checkbox, ‘First row has column names.’
我们将数据源选择为Microsoft Excel,并提供Excel文件路径。 在我们的Excel工作表中,第一行具有列名,因此我们将选中“第一行具有列名”复选框。
We will enter the destination as Microsoft OLE DB Provider for SQL Server and choose the Server name and Database name
我们将输入目的地作为SQL Server的Microsoft OLE DB提供程序,然后选择服务器名称和数据库名称。
We’ll select option ‘Copy data from one or more tables or views.’
我们将选择“从一个或多个表或视图复制数据”选项。
We’ll click the Excel sheet name that contains the data and the destination table name.
我们将单击包含数据和目标表名称的Excel工作表名称。
We’ll run the package. If we want to save the package, we will click on the ‘Save SSIS Package’ checkbox.
我们将运行该程序包。 如果要保存包,我们将单击“保存SSIS包”复选框。
Once Data import is successful, it will show progress and status as success with number of rows transferred message.
数据导入成功后,它将显示进度和状态为成功,并显示已传输的行数消息。
 最低0.47元/天 解锁文章


 3254
3254

 被折叠的 条评论
为什么被折叠?
被折叠的 条评论
为什么被折叠?
 到【灌水乐园】发言


