


sql2012 ssrs
Microsoft released many new features in Reporting Services with the SQL 2016 release.:
Microsoft通过SQL 2016版本在Reporting Services中发布了许多新功能:
- New Report Portal 新报告门户
- Paginated Report Enhancements 分页报表增强
- Mobile Report Publisher 移动报告发布者
新报告门户 (New Report Portal)
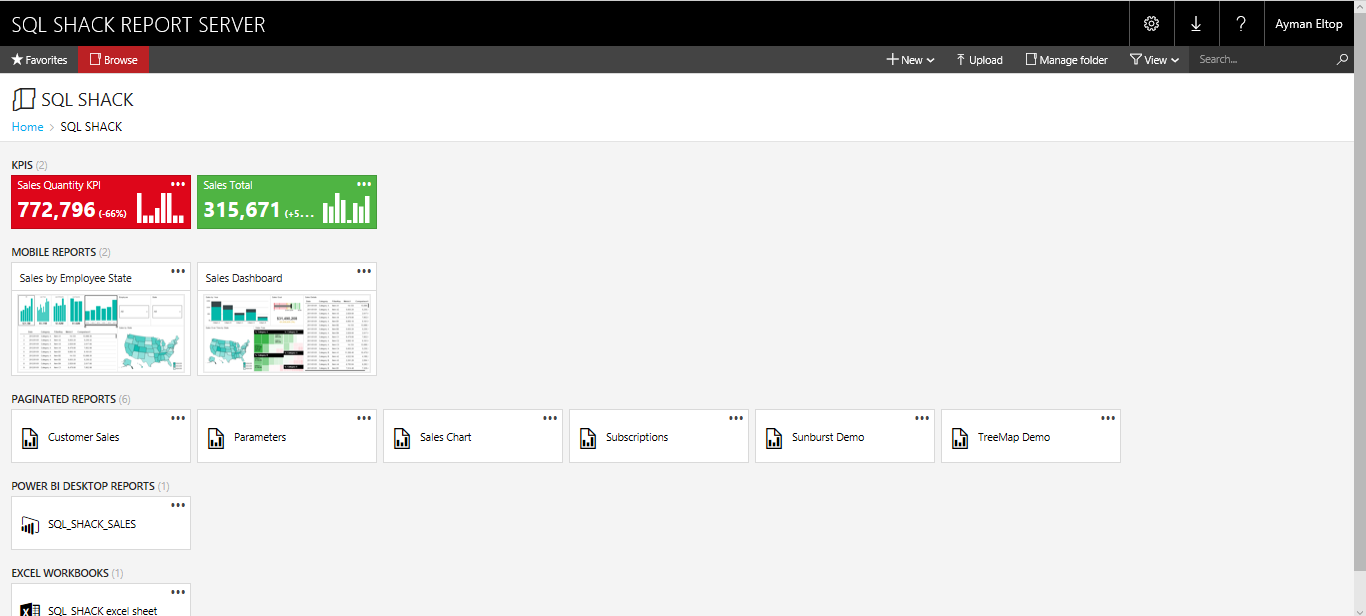
The first thing you will note with SQL Server 2016 Reporting Services is the Report Manager has had a complete facelift. It is not even the Report Manager anymore; it is now the Report Portal.
使用SQL Server 2016 Reporting Services时要注意的第一件事是报表管理器进行了全面的改版。 它甚至不再是报表管理器。 现在是报告门户。
With the reinvention of the Report Portal, Microsoft took the opportunity to give it a nice, attractive-looking user interface, very modern and sleek as you can see in the following figure:
随着报表门户的重塑,Microsoft借此机会为其提供了一个美观,美观的用户界面,非常现代且时尚,如下图所示:
报表门户的新功能 (New Report Portal Features)
- KPIs in the Report Portal: With the new Report Portal in SQL Server 2016 comes the ability to display KPIs, or key performance indicators, directly within the Report Portal, also it’s quite easy to create a KPI on your Report Portal. 报表门户中的KPI: SQL Server 2016中新增的报表门户具有直接在报表门户中显示KPI或关键绩效指标的功能,而且在报表门户上创建KPI也非常容易。
- Branding the Report Portal: Branding is the ability to customize a Report Portal for your company. We can add our corporate logo, as well as applying our company color scheme and you can see more details about how to implement your custom branding package in this link.
- 对报告门户进行品牌化:品牌化是为您的公司自定义报告门户的能力。 我们可以添加公司徽标以及应用公司的配色方案,并且可以在此链接中查看有关如何实施自定义品牌包装的更多详细信息。
- New Subscription Features: in 2016 Microsoft has enhanced the subscriptions to be more easy to enable, disable our subscriptions and in the change as well 新增订阅功能: 2016年,Microsoft对订阅进行了增强,使其更易于启用,禁用我们的订阅以及进行更改
- HTML5-compliant: The Report Portal mow is totally HTML5-compliant as are all of the reporting types, such as the mobile reports or the paginated reports. This a big impact when it comes to Reporting Services in that it is now multi-browser. We can use not only Internet Explorer, but the new Edge browser, Chrome, Firefox, Opera, a whole variety of browsers can all be used to view your Reporting Services reports. And not just multi-browser, but multiplatform. Any platform that has a browser, which is HTML5 compliant, will be able to see and view your reports just like you design them. This means your reports are now accessible from a Mac machine running Safari, for example, or perhaps a Linux machine running Firefox. 兼容HTML5 :报告门户网站的割草机与所有报告类型(例如移动报告或分页报告)完全兼容HTML5。 对于Reporting Services而言,这是一个巨大的影响,因为它现在是多浏览器。 我们不仅可以使用Internet Explorer,而且可以使用新的Edge浏览器,Chrome,Firefox,Opera和各种浏览器来查看您的Reporting Services报告。 不仅是多浏览器,而且是多平台。 任何具有兼容HTML5的浏览器的平台,都可以像设计报表一样查看和查看您的报表。 这意味着您现在可以从运行Safari的Mac计算机或运行Firefox的Linux计算机访问报告。
You can see the list of all supported browsers in this link.
您可以在此链接中看到所有受支持的浏览器的列表。
- Finally, there is a Resources area where You can upload any other file types like Word documents and PDFs. 最后,在“资源”区域中,您可以上载任何其他文件类型,如Word文档和PDF。
分页报表增强功能: (Paginated Report Enhancements:)
Microsoft has released several new features for use in paginated reports. Let’s dive in with them in the following points:
Microsoft已发布了一些用于分页报表中的新功能。 让我们与他们一起探讨以下几点:
- Embedded Reports: With SQL Server 2016, Microsoft has made it extremely easy to embed Reporting Services mobile and paginated reports that are stored on the report server within other applications by using an iframe along with URL parameters. 嵌入式报表:通过使用SQL Server 2016,Microsoft通过使用iframe和URL参数,非常容易地将Reporting Services移动和分页报表嵌入存储在报表服务器中的其他应用程序中。
Check out this link for more details
查看此链接以获取更多详细信息 - New Parameter Capabilities: This is one of the most exciting enhancements, that is concerning parameters. Specifically, parameters can now arrange at the discretion of the report developer. Yes, you now have control over how your parameters can order it within your reports新参数功能:这是与参数有关的最令人兴奋的增强功能之一。 具体来说,现在可以由报表开发者自行决定参数的安排。 是的,您现在可以控制参数如何在报告中进行排序
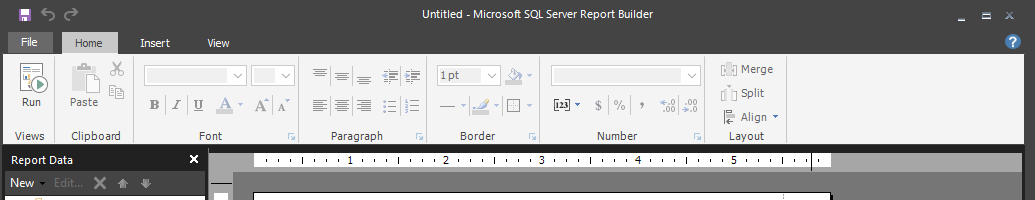
- New Report Builder User Interface: The Core Report Builder user interface is now a modern look and feels with streamlined UI elements. 新的Report Builder用户界面: Core Report Builder用户界面现在具有简化的UI元素,具有现代感。
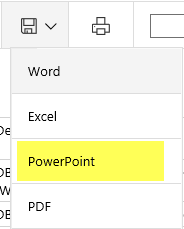
- New two types of charts: 新的两种类型的图表:

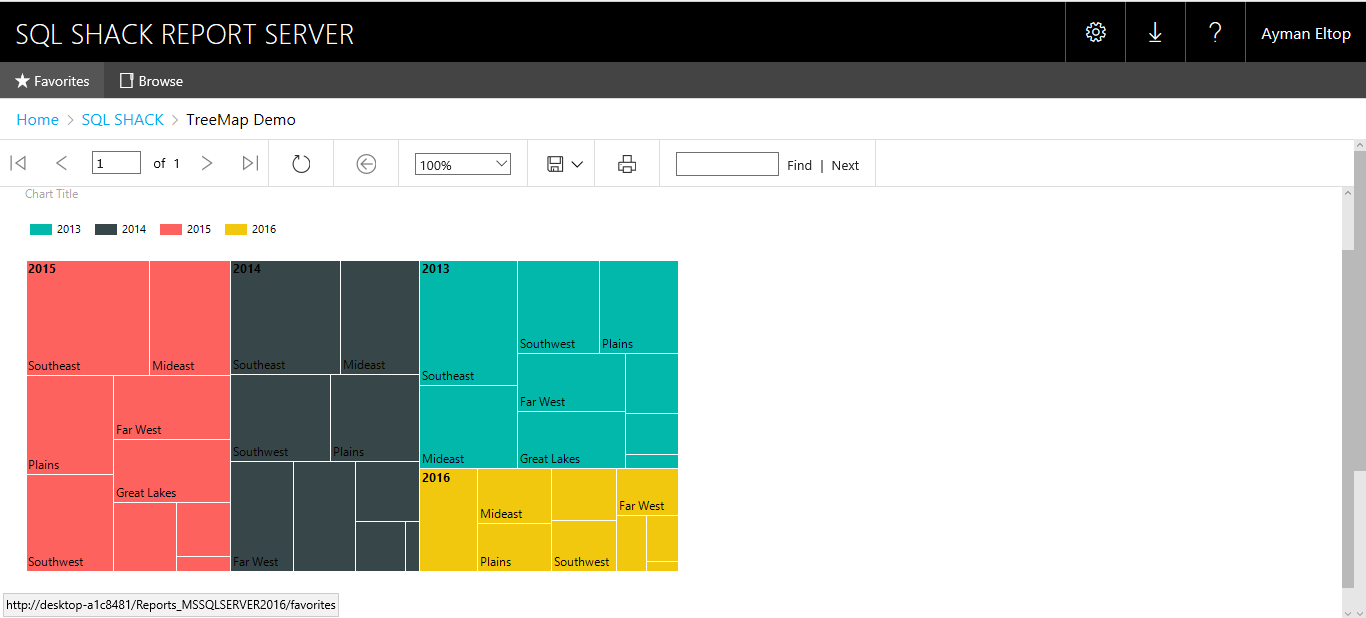
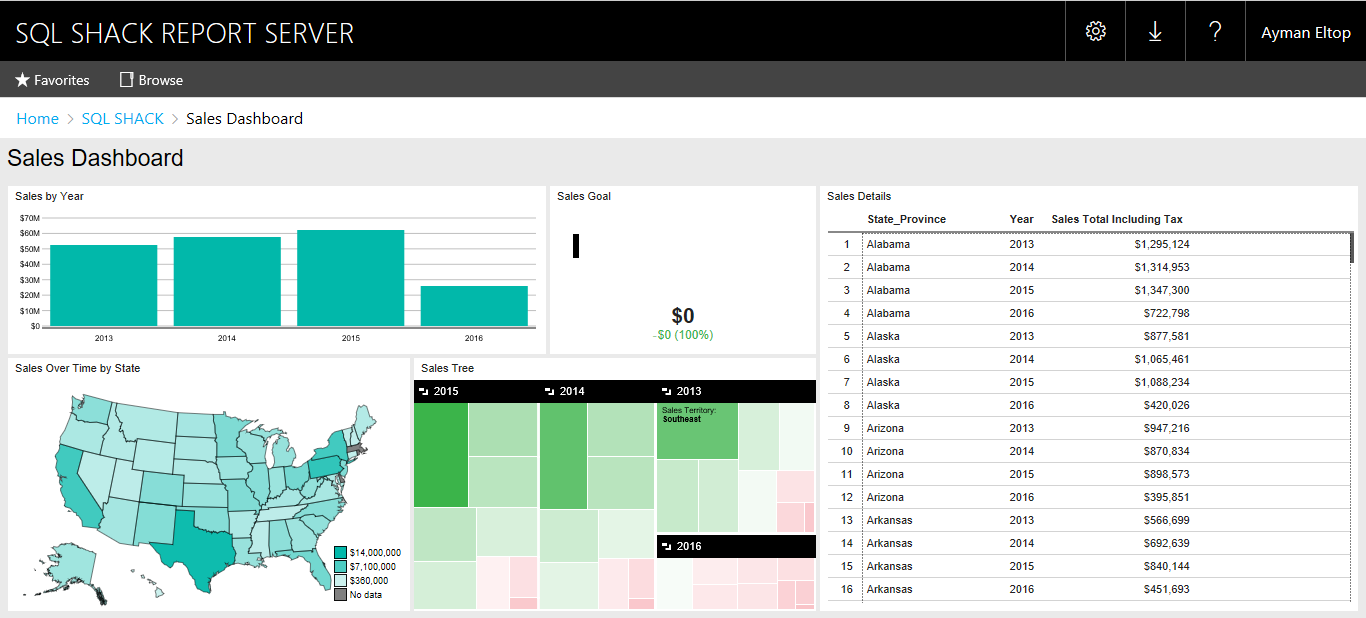
- Treemap Chart: With a treemap, the size of the block represents the size of the value. We then have larger squares, which in this case represent years, so I’ve got 2015 in pink, 2014 in gray, and so forth. The size of the large box represents the total in comparison to the others so that we can see 2013 takes up the smallest amount of space. Therefore its total was the smallest compared to by other areas. Now, within our bigger boxes, we are broken down into smaller boxes. As you can see 2015 has Southeast, Mideast, Plains, and so forth, and those represent the sales territory. 树状图:使用树状图时,块的大小代表值的大小。 然后,我们有更大的正方形,在这种情况下,代表几年,所以我用粉色表示2015年,用灰色表示2014年,依此类推。 大盒子的大小代表其他盒子的总和,因此我们可以看到2013年占据的空间最小。 因此,与其他地区相比,它的总数是最小的。 现在,在更大的盒子中,我们被分解为更小的盒子。 如您所见,2015年有东南,中东,平原等,这些代表了销售区域。
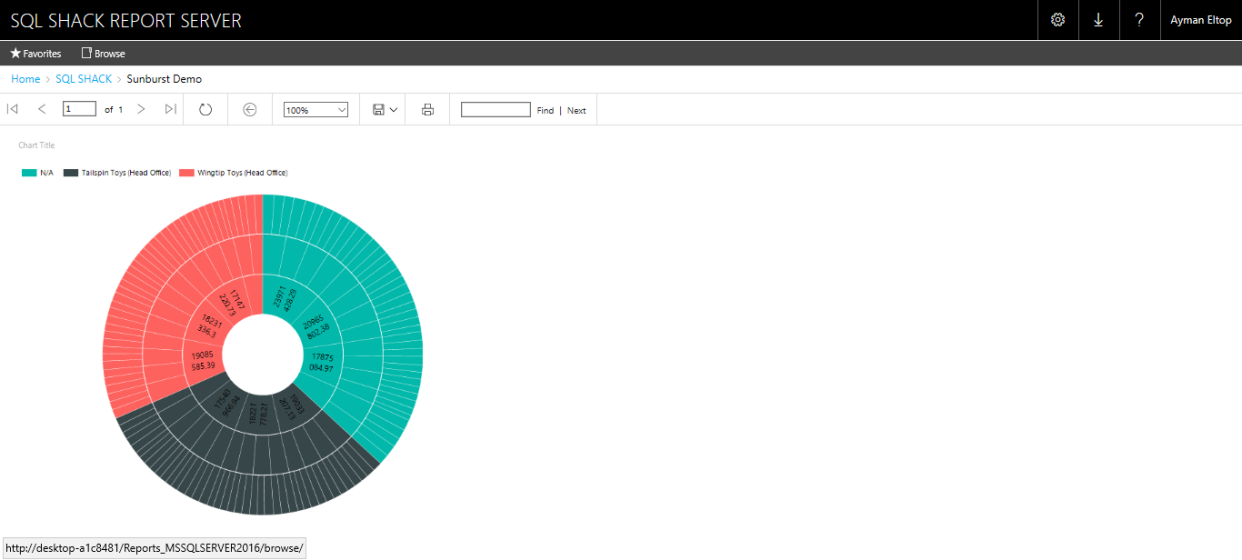
Figure 2 Treemap Chart report 图2树状图图表报告 - Sunburst Chart: as you can see in figure 3, the sunburst is essentially a pie chart, but within each wedge of the pie we can break it down into smaller pieces along the lines of a hierarchy. As you can see here, each color represents a company. For each company I have broken it out by the Year, which is in the inner circle, the middle circle represents the Quarter, and the outermost circle represents the Month. 朝阳图 :如图3所示,朝阳图本质上是一个饼图,但是在饼图的每个楔形图中,我们都可以沿着层次结构将其分解为较小的部分。 如您所见,每种颜色代表一个公司。 对于每家公司,我都按年细分了,在内圈中,中间圈代表季度,最外圈代表月份。
Figure 3 sunburst chart report 图3朝阳图报告
移动报表发布者: (Mobile Report Publisher:)
The new Mobile Report Publisher provides an easy way to design dashboards for use in your Reporting Services environment.
新的Mobile Report Publisher提供了一种简单的方法来设计仪表板,以便在Reporting Services环境中使用。
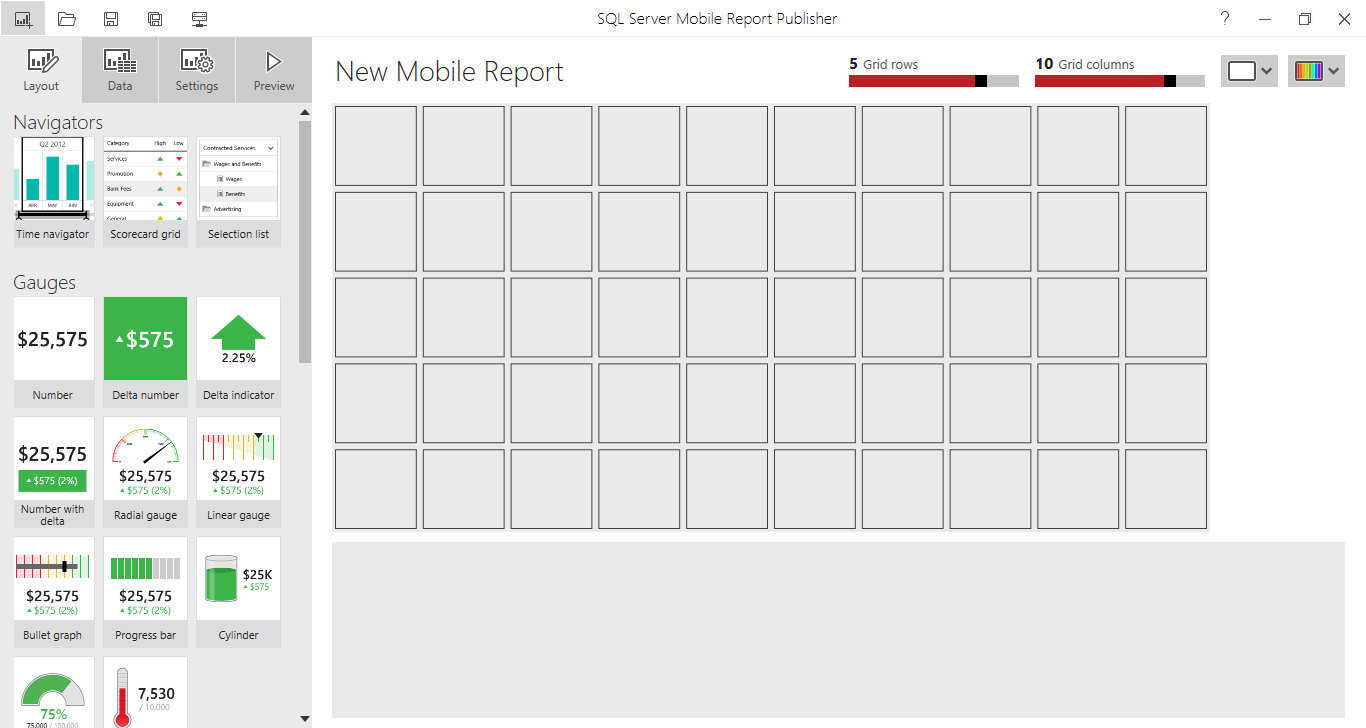
One of the nice things about the report publisher is it separates the data from the design. By that I mean that you can first design what you want the dashboard to look like, then you can import the data and marry it to the report. You could also go the reverse route. You can import your data first, then marry that data to the report elements that make the most sense for the display purposes. Also, the Report Publisher allows you to create layouts for multiple platforms. Of course, as you’d expect, you can create ones for the web as in the following figure,
关于报表发布者的好处之一是它可以将数据与设计分开。 我的意思是,您可以先设计您想要的仪表板外观,然后再导入数据并将其与报表结合。 您也可以选择反向路线。 您可以先导入数据,然后将该数据与最适合显示目的的报表元素结合。 此外,报表发布器还允许您为多个平台创建布局。 当然,正如您所期望的,您可以为网络创建一个,如下图所示,
You can also create layouts for tablets or phones. This is an important ability, in today’s world of connected devices, your business users are often using multiple platforms to access your reports.
您还可以为平板电脑或手机创建布局。 这是一项重要功能,在当今连接设备的世界中,您的企业用户经常使用多个平台来访问您的报告。
结论 (Conclusion)
I believe that Microsoft SQL Server 2016 reporting services are going to be the most used BI tool from now and ever with all of these continuously updates.
我相信,Microsoft SQL Server 2016报表服务将成为从现在到现在最常用的BI工具,并且所有这些都会不断更新。
In this article, I talked simply about all new features introduced by Microsoft, and I encourage you to keep hands-on this tool. I hope this article has been informative for you.
在本文中,我仅讨论了Microsoft引入的所有新功能,并鼓励您继续使用此工具。 希望本文对您有所帮助。
参考资料 (References)
- What’s new in SQL Server Reporting Services (SSRS) SQL Server Reporting Services(SSRS)的新增功能
- Top 3 Reasons to upgrade to SQL Server 2016 Reporting Services 升级到SQL Server 2016 Reporting Services的3大理由
- Browser Support for Reporting Services and Power View 浏览器对Reporting Services和Power View的支持
翻译自: https://www.sqlshack.com/whats-new-in-sql-server-2016-reporting-services-ssrs/
sql2012 ssrs


 867
867

 被折叠的 条评论
为什么被折叠?
被折叠的 条评论
为什么被折叠?
 到【灌水乐园】发言


