


collector
什么是SQL Server数据收集器 (What is SQL Server Data Collector)
SQL Server数据收集器是SQL Server Management Studio中提供的性能监视和调整功能。 它是在SQL Server 2008中引入的,可在企业版,标准版,商业智能版和Web版中使用。它可以收集什么信息? (What information can it gather?)
Data Collector can gather performance information from multiple SQL Server instances and store it in a single repository. It has three built-in data collecting specifications (data collectors) designed to collect the most important performance metrics. The information collected by default is about disk usage, query statistics, and server activity. You can also create additional data collectors and monitor more metrics
Data Collector可以从多个SQL Server实例收集性能信息,并将其存储在单个存储库中。 它具有三个内置的数据收集规范(数据收集器),旨在收集最重要的性能指标。 默认情况下,收集的信息与磁盘使用情况,查询统计信息和服务器活动有关。 您还可以创建其他数据收集器并监视更多指标
数据收集器如何工作? (How does Data Collector work?)
Data Collector can run constantly, or on a pre-defined schedule
Data Collector可以持续运行,也可以按预定的时间表运行
“The data collector also uses a data warehouse, a relational database that enables you to manage the data that you collect by setting different retention periods for your data.” [1]
“数据收集器还使用数据仓库,这是一个关系数据库,使您可以通过为数据设置不同的保留期限来管理收集的数据。” [1]
It is recommended for the Management Data Warehouse (MDW) database to be stored in a non-production SQL Server instance. The best solution is to use a SQL Server instance designated only for the MDW, as the feature doesn’t have an option to exclude a specific database from data collecting. Keep in mind that the MDW can grow fast and make sure you have enough free disk space available. The MDW growth rate depends on the number of transactions, and for high-transaction databases, this can be a couple of hundred MBs a day
建议将管理数据仓库(MDW)数据库存储在非生产SQL Server实例中。 最好的解决方案是使用仅为MDW指定SQL Server实例,因为该功能无法选择从数据收集中排除特定数据库。 请记住,MDW可以快速增长,并确保您有足够的可用磁盘空间。 MDW的增长率取决于事务数,对于高事务数据库,每天可能达到数百MB
One DMW database can be used as a central database repository for all monitored SQL Server instances
一个DMW数据库可以用作所有受监视SQL Server实例的中央数据库存储库
The data it captures is not only displayed in real-time graphs, like with Activity Monitor, but also saved for later analysis
它捕获的数据不仅像“活动监视器”一样显示在实时图形中,而且还保存起来供以后分析
Besides Data Warehousing, Data Collector uses SQL Server Agent and Integration Services
除了数据仓库,Data Collector还使用SQL Server代理和Integration Services。
Once Data Collector is enabled, it creates a number of scheduled jobs necessary for automatic data collection and data upload into the MDW database. They are also used to purge stored. The feature also adds tables to the msdb database, to store the configuration, auditing and collection history information, job information and SSIS packages
启用数据收集器后,它将创建许多自动收集数据并将数据上载到MDW数据库所需的计划作业。 它们还用于清除存储的内容。 该功能还将表添加到msdb数据库中,以存储配置,审核和收集历史记录信息,作业信息和SSIS包
Integration Services packages transform and load the collected data into the MDW database
Integration Services软件包将收集的数据转换并加载到MDW数据库中
“Collection sets are defined and deployed on a server instance and can be run independently of each other. Each collection set can be applied to a target that matches the target types of all the collector types that are part of a collection set. The collection set is run by a SQL Server Agent job or jobs, and data is uploaded to the management data warehouse on a predefined schedule.” [1]
“集合集已定义并部署在服务器实例上,并且可以彼此独立运行。 可以将每个收集集应用于与作为收集集一部分的所有收集器类型的目标类型匹配的目标。 收集集由一个或多个SQL Server代理作业运行,并且数据按预定义的时间表上载到管理数据仓库。” [1]
预定义的数据收集集 (Predefined data collection sets)
The Disk Usage data collection set collects information about disk space used by both data and log files for all databases on the SQL Server instance, growth trends, and average day growth
磁盘使用率数据收集集收集有关SQL Server实例上所有数据库的数据和日志文件使用的磁盘空间,增长趋势和平均日增长的信息
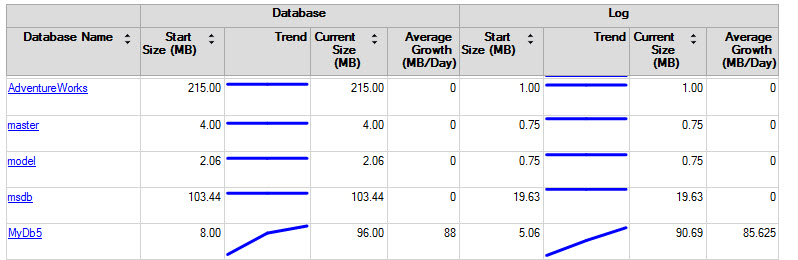
By default, the Disk Usage data collection set collects data every 60 seconds and uploads data into the MDW database every 6 hours in non-cached mode
默认情况下,“ 磁盘使用情况”数据收集集每60秒收集一次数据,并在非缓存模式下每6小时将数据上传到MDW数据库中
“In non-cached mode, collection and upload are on the same schedule. The packages start, collect, and upload data at their configured frequency, and run until they are finished. There is only one job created for collection sets in non-cached mode. Non-cached mode allows for the collection and uploading of data to occur on demand, as well as at the intervals specified in the job.” [2]
“在非缓存模式下,收集和上传的时间表相同。 程序包以配置的频率启动,收集和上载数据,并运行直到完成。 在非缓存模式下,仅为收集集创建了一项作业。 非缓存模式允许按需以及在作业中指定的时间间隔进行数据的收集和上传。” [2]
The Query Statistics data collection set collects information about query statistics, activity, execution plans and text on the SQL Server instance. It does not store all executed statements, only 10 worst performing ones
查询统计数据收集集收集有关SQL Server实例上的查询统计,活动,执行计划和文本的信息。 它不存储所有已执行的语句,仅存储10个性能最差的语句
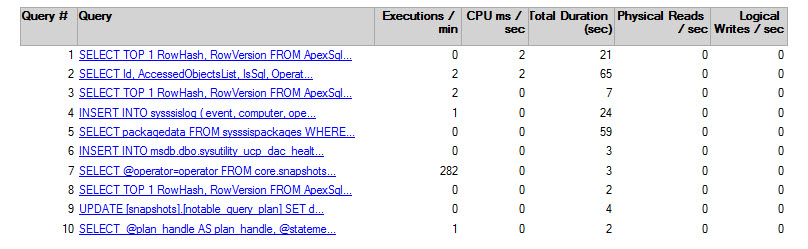
To collect more than top 10 worst performing queries, disable the default Query Statistics Collection Set and create a custom one using T-SQL or its API
要收集超过10个性能最差的查询,请禁用默认的“查询统计信息收集集”,并使用T-SQL或其API创建自定义查询
The Query Statistics data collection set uploads the collected data in the cached mode
查询统计数据收集集以缓存模式上载收集的数据
“In cached mode, the data collection and uploading of jobs are on different schedules, so two jobs are created for each collection set. Cached mode supports continuous collection of data, but less frequent uploads. For example, the default Server Activity collection set uploads data by default every 15 minutes. However, the collection items are collected every 60 seconds.” [2]
“在缓存模式下,作业的数据收集和上传按不同的时间表进行,因此为每个收集集创建两个作业。 缓存模式支持连续收集数据,但上传频率较低。 例如,默认的“服务器活动”收集集默认每15分钟上传一次数据。 但是,收集项目每60秒收集一次。” [2]
In the cached more, one SQL Server job is executed every 60 seconds to collect the data. This data is stored (cached) into a local cache folder. Another job is run every 15 minutes to read the cached data and insert it into the MDW database
在更多缓存中,每60秒执行一次SQL Server作业以收集数据。 此数据存储(缓存)到本地缓存文件夹中。 每隔15分钟运行一次作业,以读取缓存的数据并将其插入MDW数据库
The cashed mode creates less overhead than non-cached
与非缓存模式相比,现金模式产生的开销更少
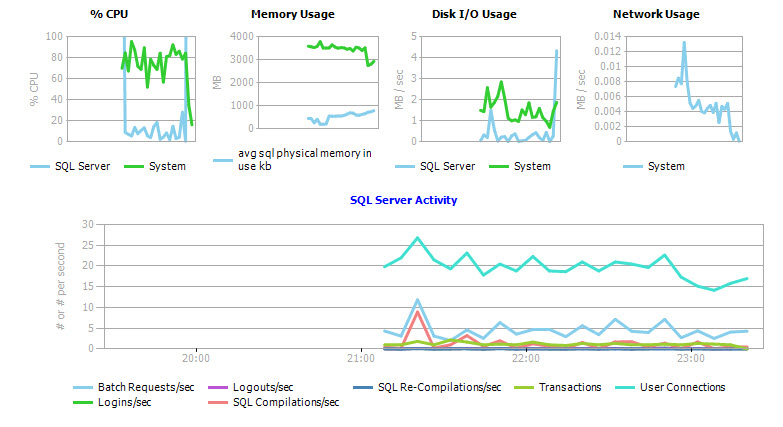
The Server Activity collection set collects information about resource usage (CPU, memory, disk I/O, and network), SQL Server waits, instance activity (batch requests, logouts, SQL compilations and recompilations, transactions, user connections, and logins), and operating system activity. Data is collected every 60 seconds and uploaded in cached mode every 15 minutes
服务器活动收集集收集有关资源使用情况(CPU,内存,磁盘I / O和网络),SQL Server等待,实例活动(批处理请求,注销,SQL编译和重新编译,事务,用户连接和登录)的信息,和操作系统活动。 每60秒收集一次数据,每15分钟以缓存模式上传一次
The Data Collector feature is pre-defined to collect the data necessary to identify and troubleshoot most common SQL Server performance problems. It can be set up easily, without coding. If you want to collect more than the pre-defined metrics, you can create custom collection sets, but coding is required. The feature provides comprehensive built-in reports for the default collection sets. In the next part of this series, we will give steps to set up the necessary pre-requests and start data collecting
数据收集器功能是预定义的,用于收集识别和排除最常见SQL Server性能问题所需的数据。 无需编码即可轻松设置。 如果您要收集的数据超过预定义的指标,则可以创建自定义收集集,但需要进行编码。 该功能为默认收集集提供了全面的内置报告。 在本系列的下一部分中,我们将提供步骤来设置必要的预请求并开始收集数据
翻译自: https://www.sqlshack.com/sql-server-performance-monitoring-data-collector/
collector


 1万+
1万+


 被折叠的 条评论
为什么被折叠?
被折叠的 条评论
为什么被折叠?
 到【灌水乐园】发言


