


collector
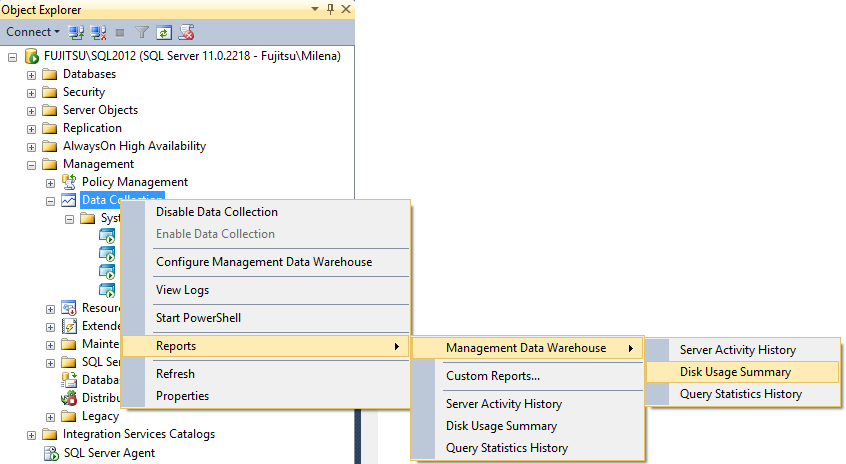
first part of this article, we described Data Collector, its features and pre-defined collection sets. In the 第一部分 ,我们介绍了Data Collector,其功能和预定义的集合集。 在 second part, we showed how to set up data collecting. In this final part, we will show the reports available in Data Collector and how to use them for performance troubleshooting 第二部分中 ,我们展示了如何设置数据收集。 在最后一部分中,我们将展示Data Collector中可用的报告以及如何使用它们进行性能故障排除The feature provides three built-in reports, one for each built-in collection set. To open a report:
该功能提供了三个内置报告,每个内置集合集都有一个。 要打开报告:
- In Object Explorer | Management, right-click Data Collection
- 在对象资源管理器中 管理 ,右键单击数据收集
- Reports and then 报告 ,然后选择Management Data Warehouse管理数据仓库
- Server Activity History, Disk Usage Summary, or 服务器活动历史记录,磁盘使用情况摘要或Query Statistics History查询统计信息历史记录
The recently used reports are also listed under the Custom reports option
最近使用的报告也在“ 自定义报告”选项下列出
If these built-in reports don’t provide enough details, or you need a report for a custom data collection set, you can use the Custom reports option and create a report of your own [1]
如果这些内置报告没有提供足够的详细信息,或者您需要自定义数据收集集的报告,则可以使用“ 自定义报告”选项并创建自己的报告[1]
The Management Data Warehouse database stores all records necessary to create reports. To make sure the latest captured records are also included in the reports:
管理数据仓库数据库存储创建报告所需的所有记录。 为了确保最新捕获的记录也包括在报告中:
- In Object Explorer | Management, right-click Data Collection
- 在对象资源管理器中 管理 ,右键单击数据收集
- System Data Collection Sets系统数据收集集
- Collect and Upload Now立即收集并上传
The Server Activity History report
服务器活动历史记录报告
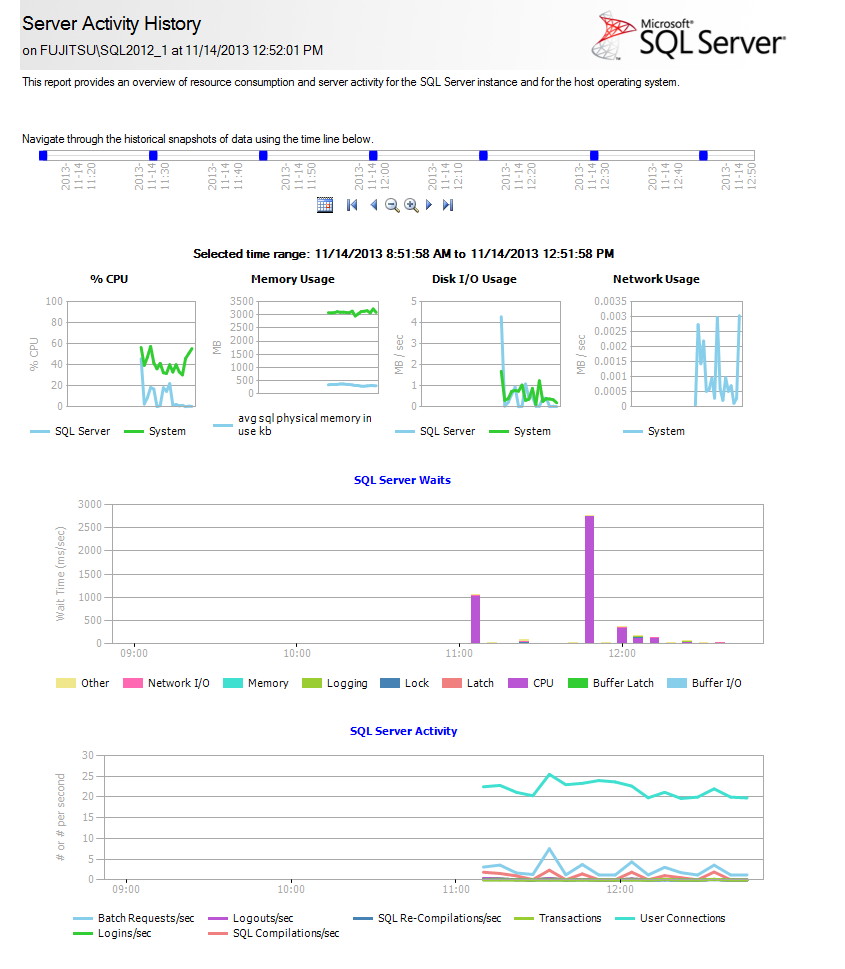
The Server Activity History report shows the activity of the monitored SQL Server instance in a specified time range. It also shows how much resources were used
服务器活动历史记录报告显示指定时间范围内受监视SQL Server实例的活动。 它还显示了使用了多少资源
The time range bar enables you to select the start and duration of the period (15 minutes, 1, 4, 12, or 24 hours) that will be shown in the report
时间范围栏使您可以选择报告中将显示的时间段的开始和持续时间(15分钟,1、4、12或24小时)
%CPU – shows how much processor capacity was used by the SQL Server instance and by the operating system
%CPU –显示SQL Server实例和操作系统使用了多少处理器容量
“A continually high rate of CPU usage may indicate the need to upgrade the CPU or add multiple processors. Alternatively, a high CPU usage rate may indicate a poorly tuned or designed application. Optimizing the application can lower CPU utilization.” [2]
“持续高的CPU使用率可能表明需要升级CPU或添加多个处理器。 或者,较高的CPU使用率可能表示应用程序调整或设计不佳。 优化应用程序可以降低CPU利用率。” [2]
Memory usage – shows average physical memory used by the SQL Server instance and by the operating system in KB
内存使用情况 –显示SQL Server实例和操作系统使用的平均物理内存,以KB为单位
“By default, SQL Server changes its memory requirements dynamically, on the basis of available system resources. If SQL Server needs more memory, it queries the operating system to determine whether free physical memory is available and uses the available memory. If SQL Server does not need the memory currently allocated to it, it releases the memory to the operating system.”[3]
“默认情况下,SQL Server根据可用的系统资源动态更改其内存要求。 如果SQL Server需要更多内存,它将查询操作系统以确定可用的物理内存是否可用,并使用可用的内存。 如果SQL Server不需要当前为其分配的内存,它将把内存释放给操作系统。” [3]
Disk I/O Usage – shows input and output calls (I/O) used by the SQL Server instance and by the operating system to perform read and write operations on the hard disk
磁盘I / O使用情况 –显示SQL Server实例和操作系统用于在硬盘上执行读写操作的输入和输出调用(I / O)
Network Usage – shows traffic over the network in MB/sec
网络使用情况 –以MB /秒为单位显示网络上的流量
SQL Server Waits Statistics – show the top wait reasons and their wait time. Clicking the graph provides drill-down information with detailed statistics
SQL Server等待统计信息 –显示最主要的等待原因及其等待时间。 单击该图可提供具有详细统计信息的深入信息
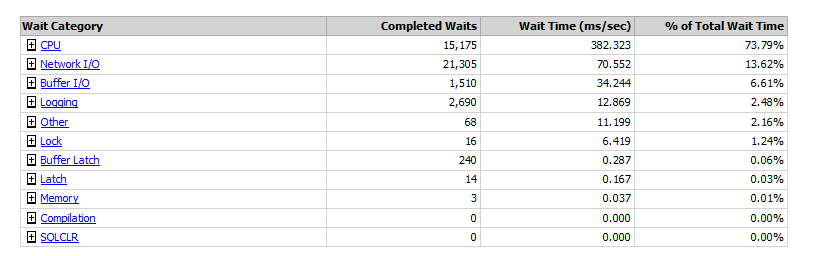
Clicking on a wait category in the list shows further details. For example, clicking the CPU shows a list of top queries on the CPU. Besides the CPU, queries can be ranked by duration, total I/O, physical reads, and logical writes
单击列表中的等待类别将显示更多详细信息。 例如,单击CPU将显示CPU上最热门查询的列表。 除CPU外,查询还可以按持续时间,总I / O,物理读取和逻辑写入进行排序
SQL Server Activity – shows the top activities per second or in percentage – batch requests, logouts, connections, compilations, recompilations, and transactions. Clicking on the graph provides more detailed information
SQL Server活动 –每秒或百分比显示最重要的活动–批处理请求,注销,连接,编译,重新编译和事务。 单击该图可提供更多详细信息
磁盘使用情况摘要报告 (The Disk Usage Summary report )
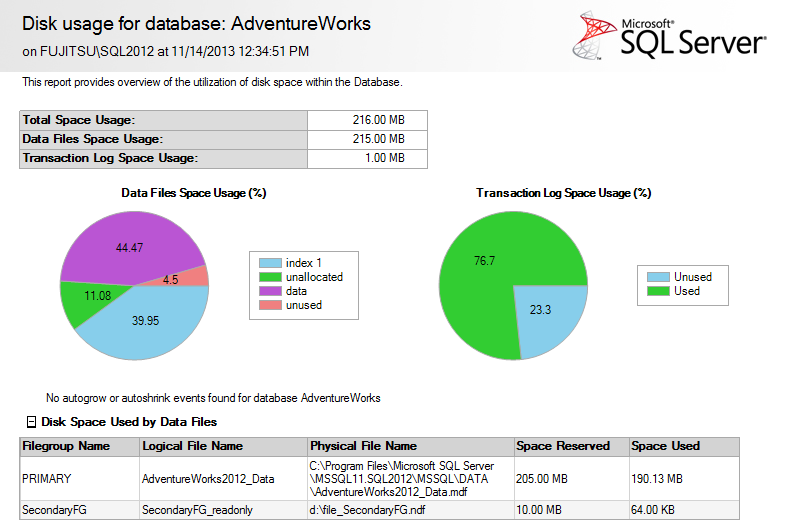
The Disk Usage Summary report shows disk space used by each database on the monitored SQL Server instance, growth trend, and average daily growth
“ 磁盘使用情况摘要”报告显示受监视SQL Server实例上每个数据库使用的磁盘空间,增长趋势和平均每日增长
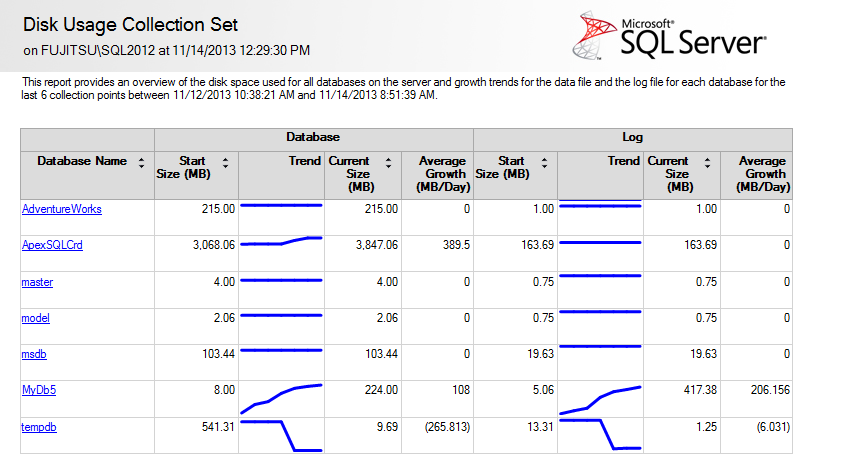
Selecting any database enables drilling down into the reports
选择任何数据库都可以深入查看报告
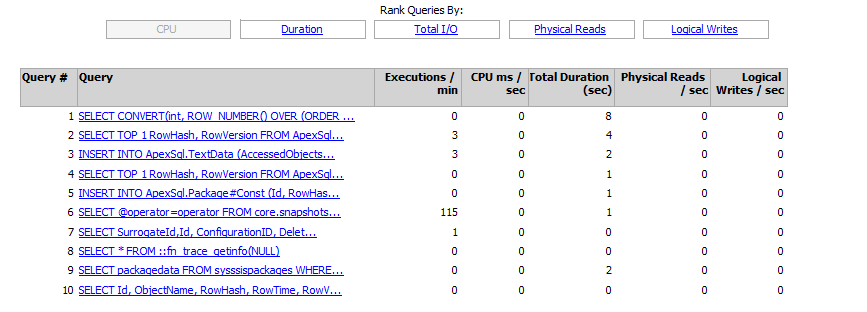
查询统计历史记录报告 (The Query Statistics History report)
The Query Statistics History report shows top 10 most expensive queries. These are the queries that use most of CPU resources in the monitored time range. The same as with the Server Activity History report, the queries can be ranked by CPU used, duration, total I/O, physical reads, and logical writes
“ 查询统计历史记录”报告显示前10个最昂贵的查询。 这些是在监视的时间范围内使用大多数CPU资源的查询。 与“ 服务器活动历史记录”报告相同,查询可以按使用的CPU,持续时间,总I / O,物理读取和逻辑写入进行排序。
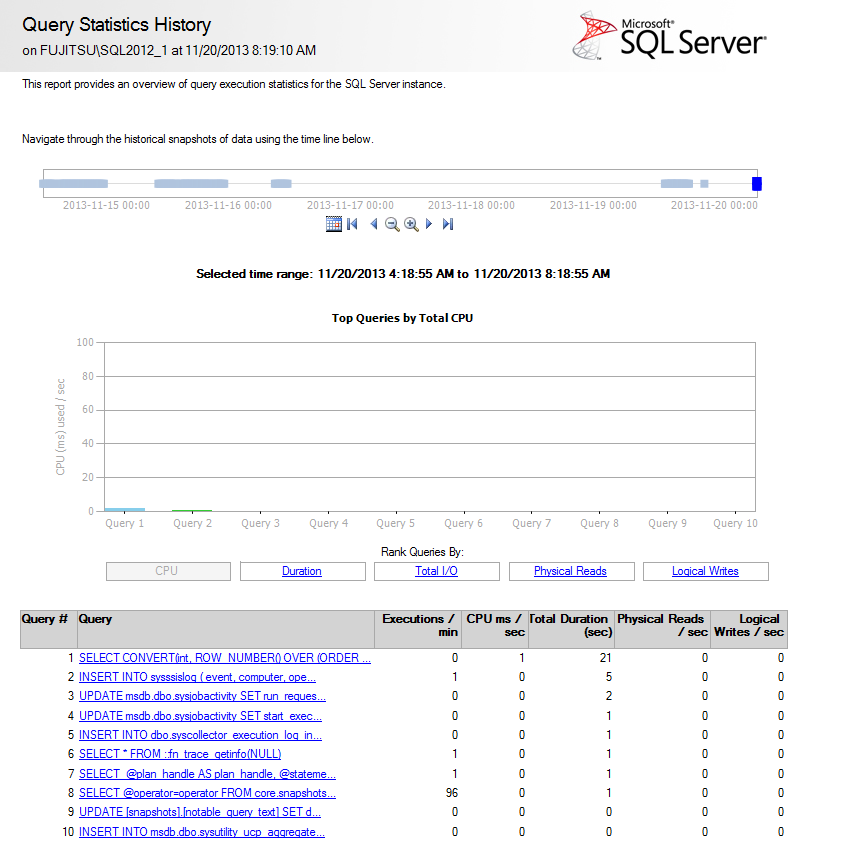
Clicking a query in the list opens sub-reports with detailed statistics. Drilling down into query statistics provides query code and execution plan used
单击列表中的查询将打开带有详细统计信息的子报告。 深入查询统计信息可提供查询代码和执行计划
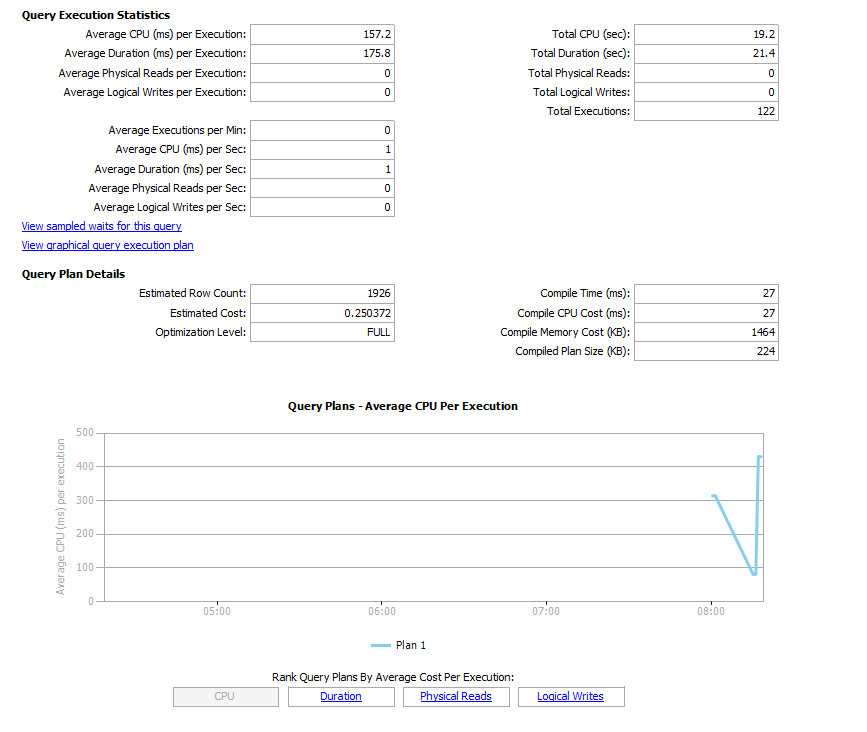
As the overall performance can be downgraded by a number frequently executed expensive queries, start the tuning with the execution plan analysis
由于许多经常执行的昂贵查询会降低整体性能,因此请从执行计划分析开始进行调优
Data Collector reports can be exported to PDF, Excel, and Word. To do that, right-click the graph and select the Export option
数据收集器报告可以导出为PDF,Excel和Word。 为此,右键单击图形并选择“ 导出”选项
The SQL Server instance performance can be affected by data collecting. To reduce this effect, combine the similar queries into the same collection items and sets. Also, keep in mind that data collections more frequent than 5 seconds add significant overhead
SQL Server实例的性能可能会受到数据收集的影响。 为了减少这种影响,请将类似的查询合并到相同的收集项和集合中。 此外,请记住,超过5秒的数据收集频率会增加大量开销
The Data Collector feature has built-in reports for the pre-defined collection sets that provide the most common performance metrics. The reports are comprehensive, easy to read, provide good details and trends for a specified period. The reports for additional collected metrics have to be created as custom. However, the result filtering is limited and the feature is not available in all SQL Server editions
数据收集器功能具有预定义集合集的内置报告,这些报告提供了最常见的性能指标。 这些报告内容全面,易于阅读,并提供了指定时期的详细信息和趋势。 必须自定义创建其他收集的指标的报告。 但是,结果筛选受到限制,并且该功能并非在所有SQL Server版本中都可用
翻译自: https://www.sqlshack.com/sql-server-performance-monitoring-data-collector-part-3-reading-reports/
collector


 822
822


 被折叠的 条评论
为什么被折叠?
被折叠的 条评论
为什么被折叠?
 到【灌水乐园】发言


