


collector
previous part of this article, we described SQL Server Data Collector, its features, and pre-defined collection sets. We showed what data is collected and described the mechanisms used to collect, store, and purge the saved records. In this part, we will give detailed steps to provide all necessary pre-requests and set up Data Collector 前一部分 ,我们介绍了SQL Server Data Collector,其功能以及预定义的集合集。 我们展示了收集哪些数据,并描述了用于收集,存储和清除保存的记录的机制。 在这一部分中,我们将给出详细的步骤以提供所有必要的预请求并设置数据收集器如何设置数据收集器以监视性能 (How to set up Data Collector to monitor performance)
Data Collector is supported only in Microsoft SQL Server 2008 and higher, in the Enterprise, Standard, Business Intelligence, and Web editions. SQL Server Integration Services must be installed
只有Microsoft SQL Server 2008和更高版本,企业版,标准版,商业智能版和Web版支持Data Collector。 必须安装SQL Server Integration Services
There are several features you should set up and/or enable: SQL Server Agent, Management Data Warehouse, and Data Collection
您应该设置和/或启用多种功能:SQL Server代理,管理数据仓库和数据收集
- Start开始
- In SQL Server Management Studio Object Explorer, expand Management
- 在SQL Server Management Studio对象资源管理器中,展开“ 管理”
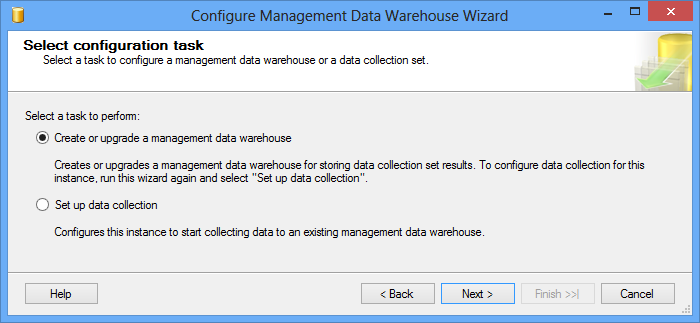
Right-click Data Collection and select Configure Management Data Warehouse
右键单击“ 数据收集”,然后选择“ 配置管理数据仓库”
Select Create or upgrade a management data warehouse as a task to perform
选择创建或升级管理数据仓库作为要执行的任务
- Next下一步
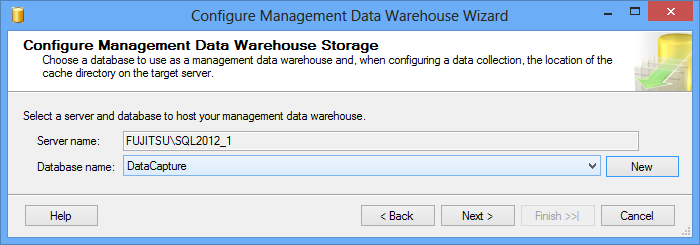
Select the SQL Server instance where the captured data will be stored. It’s recommended to select a different server from the one where data will be captured, to avoid capturing data for the storage database and reduce overhead
选择将存储捕获的数据SQL Server实例。 建议选择与要捕获数据的服务器不同的服务器,以避免捕获存储数据库的数据并减少开销
It’s also recommended to have a database that will only store collected data. If you haven’t created it earlier, click New and do it here
还建议您使用一个仅存储收集到的数据的数据库。 如果您尚未创建它,请单击“ 新建”并在此处执行
- Next下一步
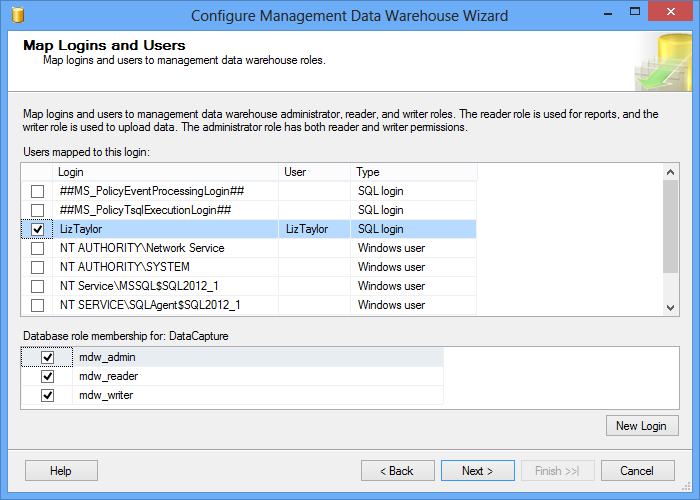
The Management Data Warehouse (MDW) uses three database roles: mdw_admin, mdw_reader, and mdw_writer. Map the appropriate roles to existing SQL Server logins, or click New Login to create a new login first
管理数据仓库(MDW)使用三个数据库角色:mdw_admin,mdw_reader和mdw_writer。 将适当的角色映射到现有SQL Server登录名,或单击“ 新建登录名”以首先创建一个新的登录名
“The mdw_admin role will allow users to read, write, update and execute SQL Server Agent which can purge and cleanup data available within a MDW database.
The mdw_reader role will allow users to read data which is available within a MDW database.
The mdw_writer role will allow users to write and upload data to a MDW database” [1]“ mdw_admin角色将允许用户读取,写入,更新和执行SQL Server代理,该代理可以清除和清除MDW数据库中可用的数据。
mdw_reader角色将允许用户读取MDW数据库中可用的数据。
mdw_writer角色将允许用户写入数据并将其上传到MDW数据库 ” [1]- Next下一步
- Data Collection and select 数据收集” ,然后再次选择“ Configure Management Data Warehouse again配置管理数据仓库”
This time, select the Set up data collection option
这次,选择设置数据收集选项
Note that this sequence of actions and selecting the same option again is necessary. First time, you have to create the MDW. In the second run, you configure the SQL Server instance for data collecting. If you run the Set up data collection option without creating the MDW first, there will be no databases in the drop-down list, you will not be able to create a new one in this wizard and configure data collecting
请注意,此操作顺序并再次选择相同的选项是必要的。 第一次,您必须创建MDW。 在第二次运行中,您将配置SQL Server实例以进行数据收集。 如果您在未先创建MDW的情况下运行“ 设置数据收集”选项,则下拉列表中将没有数据库,您将无法在此向导中创建新数据库并配置数据收集
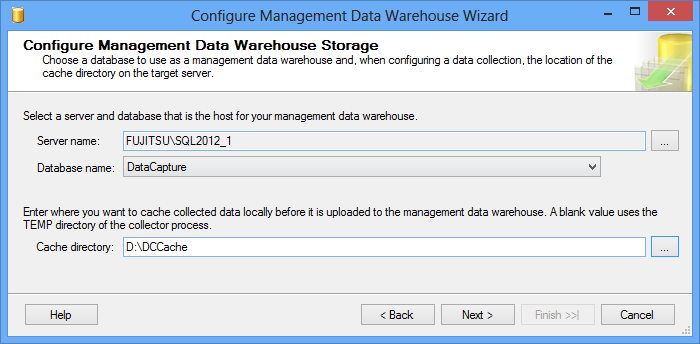
Select the DataCapture database created earlier. The Cache directory is the directory where data is collected locally before uploading into the MDW. This option is used for the collection sets that upload data in cached mode
选择之前创建的DataCapture数据库。 缓存目录是在上载到MDW之前在本地收集数据的目录。 此选项用于以缓存模式上传数据的集合集
数据收集预定义集 (Data Collection pre-defined sets)
To see the data collection sets created by Management Data Warehouse Wizard, expand Data Collection in Object Explorer
要查看由“管理数据仓库向导”创建的数据收集集,请在“对象资源管理器”中展开“ 数据收集”
Three data collection sets are created. They collect the data that is commonly needed to diagnose and troubleshoot performance issues. Each collection set can be manually stopped and started, and the data collection and upload into the MDW can be manually initiated. Data is collected for all databases on the SQL Server instance. That’s why it’s not recommended to have the MDW on the same instance
创建了三个数据收集集。 他们收集诊断和解决性能问题通常所需的数据。 可以手动停止和启动每个收集集,并且可以手动启动数据收集和上载到MDW。 将收集SQL Server实例上所有数据库的数据。 这就是为什么不建议在同一实例上安装MDW的原因
The Disk Usage data collection set collects information about disk space used by the database data and log files
磁盘使用率数据收集集收集有关数据库数据和日志文件使用的磁盘空间的信息
It has two collection items – one for collecting data for the data files (MDF, NDF), and the other for the transaction log file (LDF)
它有两个收集项目–一个用于收集数据文件(MDF,NDF)的数据,另一个用于事务日志文件(LDF)
“The collection set gathers the following data:
“ 收集集收集以下数据:
- Snapshots of data file sizes obtained from the sys.partitions and sys.allocation_units views.从sys.partitions和sys.allocation_units视图获得的数据文件大小的快照。
- Snapshots of log file sizes obtained from the DBCC SQLPERF (LOGSPACE) command.从DBCC SQLPERF(LOGSPACE)命令获得的日志文件大小的快照。
- Snapshots of I/O statistics from the sys.dm_io_virtual_file_stats function.”[2]sys.dm_io_virtual_file_stats函数的I / O统计信息的快照。 ” [2]
Code for each of the collection items is shown in the Input parameters field. As the Collection Frequency column shows, data for both collection items is collected every 60 seconds
每个收集项目的代码显示在“输入参数”字段中。 如“收集频率”列所示,每60秒收集两个收集项目的数据
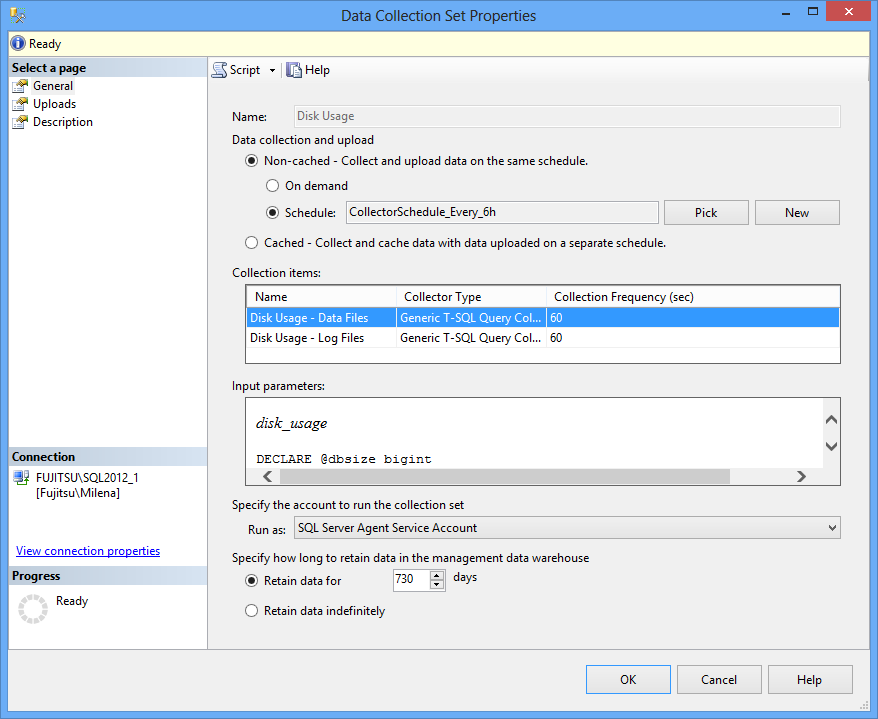
By default, collected data is uploaded into the MDW every 6 hours. To change this behavior, click Pick and select one of existing schedules, or click New and create a new one
默认情况下,每6小时将收集的数据上载到MDW。 若要更改此行为,请单击“选择”并选择现有计划之一,或单击“ 新建”并创建一个新计划。
The data collection and upload mode can also be changed
数据收集和上传模式也可以更改
By default, collected data is kept in the MDW for 2 years. As keeping collected data for so long can take up much of hard disk space, it’s recommended to reduce this number. First, determine how far back you need the collected data for analysis. Then calculate how much space data collecting for all your SQL Server instances will take. Keep in mind that in high transaction databases, MDW growth can be 200 – 300 MB a day
默认情况下,收集的数据在MDW中保存2年。 由于将收集的数据保存很长时间会占用大量硬盘空间,因此建议减少此数量。 首先,确定需要多远的时间来进行分析。 然后计算收集所有SQL Server实例所需的空间数据。 请记住,在高事务数据库中,MDW每天可以增长200 – 300 MB
The Query Statistics data collection set has a single collection item that collects information about query statistics, activity, execution plans, and code on the SQL Server instance
Query Statistics数据收集集具有一个收集项,该收集项收集有关SQL Server实例上的查询统计信息,活动,执行计划和代码的信息
“This collection set collects data from the following sources:
“此收集集从以下来源收集数据:
- sys.dm_exec_requests, sys.dm_exec_sessions, sys.dm_exec_query_stats and other related dynamic management views.sys.dm_exec_requests,sys.dm_exec_sessions,sys.dm_exec_query_stats和其他相关的动态管理视图。
- The text of selected batches and queries.所选批次和查询的文本。
- The plan of selected batches and queries.所选批次和查询的计划。
- The normalized text of selected batches.”[2]所选批次的规范化文本。 ” [2]
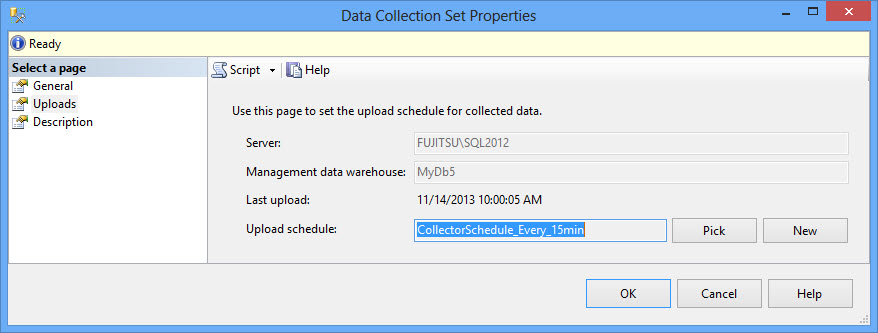
By default, it collects data every 10 seconds and uploads it in the cached mode every 15 minutes, as shown in the Uploads tab
默认情况下,它每10秒收集一次数据,并每15分钟以缓存模式上传一次数据,如“ 上传”标签中所示
The Server Activity data collection set collects information about resources used by the SQL Server instance (processor, memory, disk I/O, and network usage), SQL Server instance activity (batch requests, logouts, SQL compilations and recompilations, transactions, user connections, and logins) and waits
服务器活动数据收集集收集有关SQL Server实例使用的资源(处理器,内存,磁盘I / O和网络使用情况),SQL Server实例活动(批处理请求,注销,SQL编译和重新编译,事务,用户连接)的信息。 ,然后登录)并等待
“This collection set collects data samples from the following dynamic management views:
“ 该收集集从以下动态管理视图收集数据样本:
- sys.dm_os_wait_statssys.dm_os_wait_stats
- sys.dm_os_latch_statssys.dm_os_latch_stats
- sys.dm_os_schedulerssys.dm_os_schedulers
- sys.dm_exec_sessions, sys.dm_exec_requests, sys.dm_os_waiting_tasks (using a joined query)sys.dm_exec_sessions,sys.dm_exec_requests,sys.dm_os_waiting_tasks(使用联合查询)
- sys.dm_os_process_memorysys.dm_os_process_memory
- sys.dm_os_memory_nodessys.dm_os_memory_nodes
Additionally, data samples are collected from several system and SQL Server performance counters.”[2]
此外,从几个系统和SQL Server性能计数器收集数据样本。 ” [2]
Also, several SQL Server Agent jobs that collect and upload the data are created
此外,还将创建几个收集和上传数据SQL Server代理作业。
“The following rules govern job creation:
“以下规则负责创造就业机会:
- Data collection by different collection sets are executed as separate jobs.不同收集集的数据收集将作为单独的作业执行。
- Collection sets that use cached collection mode are scheduled as jobs that start when the SQL Server Agent starts. These jobs run continuously and are controlled by the data collector run-time component.
- 使用缓存收集模式的收集集被安排为在SQL Server代理启动时启动的作业。 这些作业连续运行,并由数据收集器运行时组件控制。
- Collection sets that use non-cached collection mode are scheduled as normal SQL Server Agent jobs. These jobs use a SQL Server Agent schedule that matches the schedule defined in the collection set. The actual duration of execution can be customized by the user.”[3]
- 使用非缓存收集模式的收集集被安排为正常SQL Server代理作业。 这些作业使用与集合集中定义的计划匹配SQL Server代理计划。 实际执行时间可由用户自定义。 ” [3]
As shown, Data Collection set up requires a number of steps that can be executed using SQL Server Management Studio options. The feature is not available in all Microsoft SQL Server editions, only in Enterprise, Standard, Business Intelligence, and Web. While the feature provides built-in capturing of the most commonly needed performance metrics, adding new metrics to data collecting requires coding. All databases on the SQL Server instance have to be monitored, which adds overhead. Unlike Activity Monitor, Data Collection enables storing captured data for a specified time period and thus enables detailed performance analysis
如图所示, 数据收集设置需要使用SQL Server Management Studio选项可以执行的许多步骤。 此功能并非在所有Microsoft SQL Server版本中都可用,只有在Enterprise,Standard,Business Intelligence和Web中才可用。 虽然此功能提供了对最常用性能指标的内置捕获,但向数据收集中添加新指标需要进行编码。 必须监视SQL Server实例上的所有数据库,这会增加开销。 与活动监视器不同,数据收集允许在指定的时间段内存储捕获的数据,从而可以进行详细的性能分析
In the next part of this article, we will show the reports available in Microsoft SQL Server Management Studio, metrics collected, and how they can help with troubleshooting performance issues
在本文的下一部分中,我们将显示Microsoft SQL Server Management Studio中可用的报告,收集的指标以及它们如何帮助解决性能问题。
翻译自: https://www.sqlshack.com/sql-server-performance-monitoring-data-collector-part-2-set-up-and-usage/
collector


 1519
1519


 被折叠的 条评论
为什么被折叠?
被折叠的 条评论
为什么被折叠?
 到【灌水乐园】发言


