


python熊猫图案
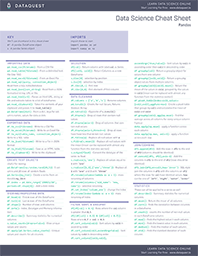
Pandas is arguably the most important Python package for data science. Not only does it give you lots of methods and functions that make working with data easier, but it has been optimized for speed which gives you a significant advantage compared with working with numeric data using Python’s built-in functions.
熊猫可以说是数据科学中最重要的Python软件包。 它不仅为您提供了许多使数据处理变得更容易的方法和功能,而且还针对速度进行了优化,与使用Python内置函数处理数字数据相比,它具有明显的优势。
The printable version of this cheat sheet
该备忘单的可打印版本
It’s common when first learning pandas to have trouble remembering all the functions and methods that you need, and while at Dataquest we advocate getting used to consulting the pandas documentation, sometimes it’s nice to have a handy reference, so we’ve put together this cheat sheet to help you out!
第一次学习熊猫时会很难记住您需要的所有功能和方法,这很常见,而在Dataquest中,我们提倡习惯于查阅熊猫文档 ,有时可以很方便地获得参考,所以我们将这一秘籍整理在一起表来帮助你!
If you’re interested in learning pandas, you can consult our two-part pandas tutorial blog post, or you can signup for free and start learning pandas through our interactive pandas for data science course.
如果您对学习熊猫感兴趣,可以查阅我们的分为两部分的熊猫教程博客文章,也可以免费注册并通过我们的交互式熊猫数据科学课程开始学习熊猫。
Download a Printable PDF of this Cheat Sheet
密钥和导入 (Key and Imports)
In this cheat sheet, we use the following shorthand:
在本备忘单中,我们使用以下速记:
dfdf | Any pandas DataFrame object | 任何熊猫DataFrame对象 |
ss | Any pandas Series object | 任何熊猫系列对象 |
You’ll also need to perform the following imports to get started:
您还需要执行以下导入才能开始:
import pandas as pd import numpy as npimport pandas as pd import numpy as np
汇入资料 (Importing Data)
pd.read_csv(filename)pd.read_csv(filename) | From a CSV file | 从CSV文件 |
pd.read_table(filename)pd.read_table(filename) | From a delimited text file (like TSV) | 来自定界文本文件(例如TSV) |
pd.read_excel(filename)pd.read_excel(filename) | From an Excel file | 从Excel文件 |
pd.read_sql(query, connection_object)pd.read_sql(query, connection_object) | Read from a SQL table/database | 从SQL表/数据库读取 |
pd.read_json(json_string)pd.read_json(json_string) | Read from a JSON formatted string, URL or file. | 从JSON格式的字符串,URL或文件中读取。 |
pd.read_html(url)pd.read_html(url) | Parses an html URL, string or file and extracts tables to a list of dataframes | 解析html URL,字符串或文件,并将表提取到数据框列表中 |
pd.read_clipboard()pd.read_clipboard() | read_table()read_table() | |
pd.DataFrame(dict)pd.DataFrame(dict) | From a dict, keys for columns names, values for data as lists | 根据字典,列名称的键,列表的数据值 |
汇出资料 (Exporting Data)
df.to_csv(filename)df.to_csv(filename) | Write to a CSV file | 写入CSV文件 |
df.to_excel(filename)df.to_excel(filename) | Write to an Excel file | 写入Excel文件 |
df.to_sql(table_name, connection_object)df.to_sql(table_name, connection_object) | Write to a SQL table | 写入SQL表 |
df.to_json(filename)df.to_json(filename) | Write to a file in JSON format | 以JSON格式写入文件 |
创建测试对象 (Create Test Objects)
Useful for testing code segements
对于测试代码段很有用
pd.DataFrame(np.random.rand(20,5))pd.DataFrame(np.random.rand(20,5)) | 5 columns and 20 rows of random floats | 5列20行随机浮动 |
pd.Series(my_list)pd.Series(my_list) | my_listmy_list创建系列 | |
df.index = pd.date_range('1900/1/30', periods=df.shape[0])df.index = pd.date_range('1900/1/30', periods=df.shape[0]) | Add a date index | 添加日期索引 |
查看/检查数据 (Viewing/Inspecting Data)
df.head(n)df.head(n) | First n rows of the DataFrame | DataFrame的前n行 |
df.tail(n)df.tail(n) | Last n rows of the DataFrame | DataFrame的最后n行 |
df.shape()df.shape() | Number of rows and columns | 行数和列数 |
df.info()df.info() | Index, Datatype and Memory information | 索引,数据类型和内存信息 |
df.describe()df.describe() | Summary statistics for numerical columns | 数字列的摘要统计 |
s.value_counts(dropna=False)s.value_counts(dropna=False) | View unique values and counts | 查看唯一值和计数 |
df.apply(pd.Series.value_counts)df.apply(pd.Series.value_counts) | Unique values and counts for all columns | 所有列的唯一值和计数 |
选拔 (Selection)
df[col]df[col] | Return column with label col as Series | 返回列的标签为系列 |
df[[col1, col2]]df[[col1, col2]] | Return Columns as a new DataFrame | 将列作为新的DataFrame返回 |
s.iloc[0]s.iloc[0] | Selection by position | 按位置选择 |
s.loc['index_one']s.loc['index_one'] | Selection by index | 按索引选择 |
df.iloc[0,:]df.iloc[0,:] | First row | 第一排 |
df.iloc[0,0]df.iloc[0,0] | First element of first column | 第一栏的第一元素 |
数据清理 (Data Cleaning)
df.columns = ['a','b','c']df.columns = ['a','b','c'] | Rename columns | 重命名列 |
pd.isnull()pd.isnull() | Checks for null Values, Returns Boolean Arrray | 检查空值,返回布尔值Arrray |
pd.notnull()pd.notnull() | pd.isnull()pd.isnull()相反 | |
df.dropna()df.dropna() | Drop all rows that contain null values | 删除所有包含空值的行 |
df.dropna(axis=1)df.dropna(axis=1) | Drop all columns that contain null values | 删除所有包含空值的列 |
df.dropna(axis=1,thresh=n)df.dropna(axis=1,thresh=n) | Drop all rows have have less than n non null values | 删除所有行的少于n个非空值 |
df.fillna(x)df.fillna(x) | Replace all null values with x | 用x替换所有空值 |
s.fillna(s.mean())s.fillna(s.mean()) | Replace all null values with the mean (mean can be replaced with almost any function from the statistics section) | 用均值替换所有空值(平均值可以用统计部分中的几乎所有函数替换) |
s.astype(float)s.astype(float) | Convert the datatype of the series to float | 将系列的数据类型转换为float |
s.replace(1,'one')s.replace(1,'one') | 1 with 1值替换为'one''one' | |
s.replace([1,3],['one','three'])s.replace([1,3],['one','three']) | 'one' and 'one'替换所有1,用3 with 'three'替换所有'three'3 | |
df.rename(columns=lambda x: x + 1)df.rename(columns=lambda x: x + 1) | Mass renaming of columns | 列的重命名 |
df.rename(columns={'old_name': 'new_ name'})df.rename(columns={'old_name': 'new_ name'}) | Selective renaming | 选择性重命名 |
df.set_index('column_one')df.set_index('column_one') | Change the index | 更改索引 |
df.rename(index=lambda x: x + 1)df.rename(index=lambda x: x + 1) | Mass renaming of index | 大规模重命名索引 |
筛选,排序和分组 (Filter, Sort & Groupby)
df[df[col] > 0.5]df[df[col] > 0.5] | 0.50.5 | |
df[(df[col] > 0.5) & (1.7)]df[(df[col] > 0.5) & (1.7)] | 0.7 > col > 0.50.7 > col > 0.5 | |
df.sort_values(col1)df.sort_values(col1) | Sort values by col1 in ascending order | 按col1升序对值排序 |
df.sort_values(col2,ascending=False)df.sort_values(col2,ascending=False) | col2 in descending ordercol2降序对值进行排序 | |
df.sort_values([col1,ascending=[True,False])df.sort_values([col1,ascending=[True,False]) | col1 in ascending order then col1升序对值排序,然后按col2 in descending ordercol2降序对值排序 | |
df.groupby(col)df.groupby(col) | Return a groupby object for values from one column | 返回一个groupby对象以获取一列中的值 |
df.groupby([col1,col2])df.groupby([col1,col2]) | Return groupby object for values from multiple columns | 从多个列返回groupby对象以获取值 |
df.groupby(col1)[col2]df.groupby(col1)[col2] | col2, grouped by the values in col2值的平均值,并按col1 (mean can be replaced with almost any function from the statistics section)col1的值分组(平均值可以用统计部分中的几乎所有函数替换) | |
df.pivot_table(index=col1,values=[col2,col3],aggfunc=max)df.pivot_table(index=col1,values=[col2,col3],aggfunc=max) | col1 and calculates the mean of col1分组并计算col2 and col2和col3col3的平均值 | |
df.groupby(col1).agg(np.mean)df.groupby(col1).agg(np.mean) | col1 groupcol1组的平均值 | |
data.apply(np.mean)data.apply(np.mean) | Apply a function across each column | 在每列上应用函数 |
data.apply(np.max,axis=1)data.apply(np.max,axis=1) | Apply a function across each row | 在每行上应用一个函数 |
加入/合并 (Join/Comine)
df1.append(df2)df1.append(df2) | df1 to the end of df1的行添加到df2 (columns should be identical)df2的末尾(列应相同) |
df.concat([df1, df2],axis=1)df.concat([df1, df2],axis=1) | df1 to the end of df1的列添加到df2 (rows should be identical)df2的末尾(行应相同) |
df1.join(df2,on=col1,how='inner')df1.join(df2,on=col1,how='inner') | df1 with the columns on df1中的列与df2 where the rows for df2中的列连接在一起,其中col have identical values. how can be one of col的行具有相同的值。 怎么可能是'left', 'left' , 'right', 'right' , 'outer', 'outer' , 'inner''inner' |
统计 (Statistics)
These can all be applied to a series as well.
这些也都可以应用于系列。
df.describe()df.describe() | Summary statistics for numerical columns | 数字列的摘要统计 |
df.mean()df.mean() | Return the mean of all columns | 返回所有列的平均值 |
df.corr()df.corr() | Finds the correlation between columns in a DataFrame. | 查找数据帧中列之间的相关性。 |
df.count()df.count() | Counts the number of non-null values in each DataFrame column. | 计算每个DataFrame列中非空值的数量。 |
df.max()df.max() | Finds the highest value in each column. | 在每一列中找到最大值。 |
df.min()df.min() | Finds the lowest value in each column. | 在每一列中找到最小值。 |
df.median()df.median() | Finds the median of each column. | 查找每列的中位数。 |
df.std()df.std() | Finds the standard deviation of each column. | 查找每列的标准偏差。 |
下载此备忘单的可打印版本 (Download a printable version of this cheat sheet)
翻译自: https://www.pybloggers.com/2017/02/pandas-cheat-sheet-python-for-data-science/
python熊猫图案


 3134
3134

 被折叠的 条评论
为什么被折叠?
被折叠的 条评论
为什么被折叠?
 到【灌水乐园】发言


