


 本文介绍了如何在Python的matplotlib库中使用命令添加希腊字母Σ(Sigma)到图表的图例中,特别是在概率领域的数据可视化中。
python 添加图例
Sigma (𝜎) is very often used greek mathematical letters and has a higher repetition in probability. In this article, we are going to add 𝜎 using a command in matplotlib.
Sigma(𝜎)是希腊数学字母中经常使用的字母,其重复率更高。 在这篇文章中,我们将添加σ在matplotlib使用命令。
plt.text(3, 0.4, r'$\sigma=100$')
#Adding 𝜎 as text

plt.title('Errorbar with 'r'$\sigma=100$')
#Adding 𝜎 in title of the figure
plt.xlabel('Time ('r'$\sigma=100)$')
#Adding 𝜎 in title of the figure
plt.ylabel('Variation ('r'$\sigma=100)$')
#Adding 𝜎 in title of the figure
在情节标签中添加omega的Python代码 (Python code for adding omega in plot label)
import numpy as np
import matplotlib.pyplot as plt
x = np.arange(0.1, 5, 0.1)
y = np.sin(x)*np.exp(-x)
# In text
plt.figure()
plt.plot(x,y, 'o', color='purple')
plt.title('Errorbar')
plt.text(4, 0.0, r'$\sigma=100$')
plt.grid()
plt.show()
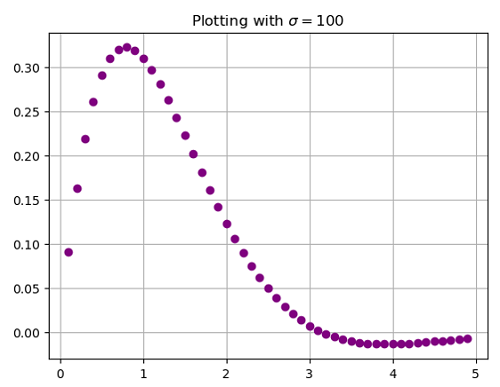
# In title
plt.figure()
plt.plot(x,y, 'o', color='purple')
plt.title('Plotting with 'r'$\sigma=100$')
plt.grid()
plt.show()
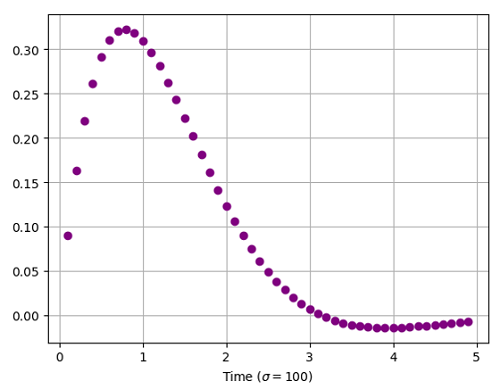
# In x-axis label
plt.figure()
plt.plot(x,y, 'o', color='purple')
plt.xlabel('Time ('r'$\sigma=100)$')
plt.grid()
plt.show()
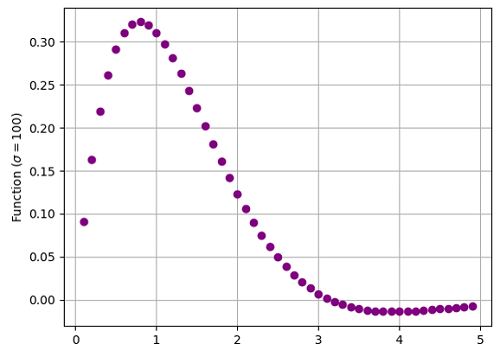
# In y-axis label
plt.figure()
plt.plot(x,y, 'o', color='purple')
plt.ylabel('Function ('r'$\sigma=100)$')
plt.grid()
plt.show()
Output:
输出:
Output is as figure
翻译自: https://www.includehelp.com/python/adding-sigma-in-plot-label.aspx
python 添加图例


 被折叠的 条评论
为什么被折叠?
被折叠的 条评论
为什么被折叠?
 到【灌水乐园】发言


