


介绍
iPhone的成功表明,用户希望从其软件体验中获得更多的交互性。 更好的交互性可以有效利用应用程序功能并提高效率,这就是为什么它不仅在个人信息管理应用程序中而且在企业业务应用程序中都极为重要的原因。 在业务应用程序中,涉及数据可视化的应用程序从更好的交互性中获得最大收益,因为在这些情况下,更高的效率和效率直接转化为更好的决策制定,因此可立即获得业务收益。 仪表板是数据可视化应用程序的典型示例。 有趣的是,当今大多数仪表板都缺乏交互性,无法创建有效的用户体验。 因此,我们决定将典型的Web 1.0仪表板添加到更具交互性和丰富性的仪表板中。 我们没有重新发明轮子,而是从头开始创建整个应用程序。 取而代之的是,我们重新控制了接口,并将其插入到现有的服务器端基础结构中。 这样,我们实现了快速而有用的转换。
我们用于此练习的仪表板是开源Pentaho BI套件的一部分。 数据和视图是分发中示例应用程序的一部分。
尽管我们的示例是仪表板应用程序,但是这些概念可以应用于需要从Web 1.0迁移到RIA的任何项目。 我们选择的RIA工具包是Adobe Flex,此处所有讨论都在该框架,Flash VM和支持库的上下文中进行。
如果您想继续,请安装以下软件应用程序:
- 免费的Flex SDK , Flash Player 9 (已安装在浏览器中)以及可选的Flex Builder 3 Public Beta 2
- Pentaho 1.6演示套件
在运行Flex界面之前,请记住要启动Pentaho服务器并登录到仪表板。 Flex界面假定您已经登录并通过身份验证。 源代码假定服务器正在端口8080上侦听HTTP请求。 如果您的Pentaho HTTP服务器正在其他端口上侦听,请适当地修改源代码。 源代码下载包中还提供了Flex接口的虚拟数据集版本,以方便那些想完全跳过安装Pentaho服务器的用户。
现在,您已经完成设置,是时候进入我们的示例应用程序了。
皮条客我的Pentaho仪表板
首先是免责声明-本文的创建是为了提供“让您的脚湿润的体验”。 如果您想在使用Flex之前有一些背景方面的经验,则不必这样做,您可能要查看learning.adobe.com或flex.org 。 本文中的代码不会尝试传达可维护代码体系结构或用户界面设计实践的最佳实践。 例如,在此示例中,我们选择不使用Ely Greenfield的图表向下钻取组件 [demo] ,因为即使它可以改善用户体验,它也会使您为启动和运行此示例付出更多的工作。 我们希望为想要使用此代码的人提供单一的复制和粘贴体验。 在混合中添加第三方组件或真正的MVC架构会使体验变得复杂。 如果您有兴趣进一步研究这些主题,那么可以在网上和Adobe开发人员连接上找到许多有用的文章。
首先,我们来看一下最终结果,以便您了解我们正在尝试创建的体验。 查看演示 。
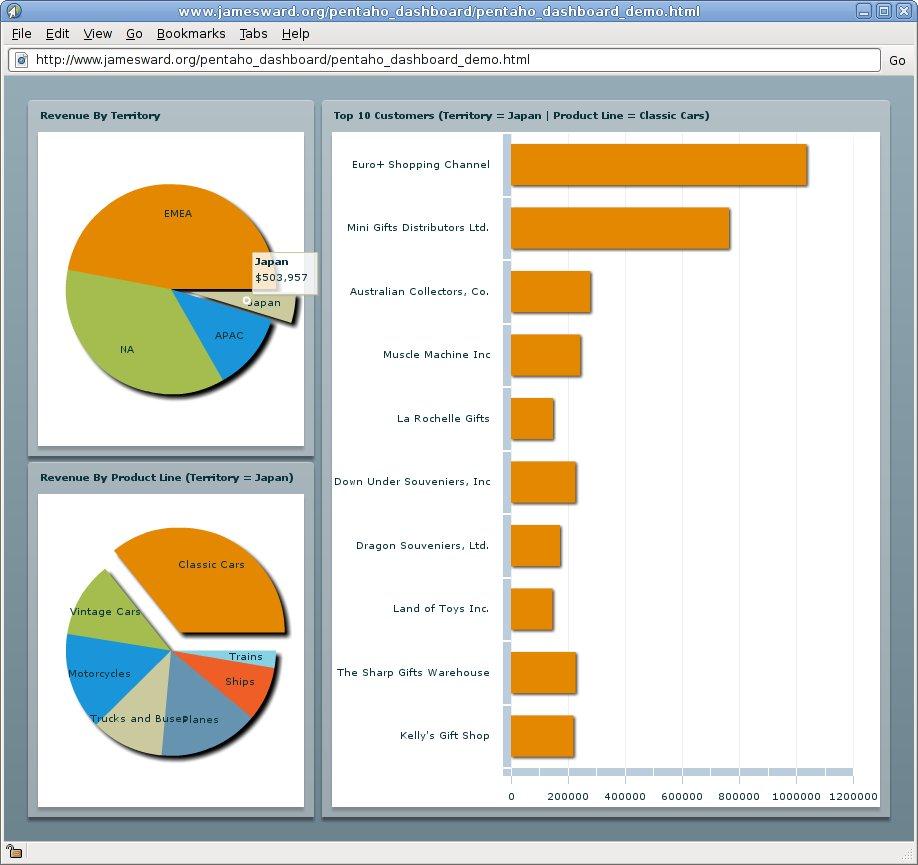
原始的Pentaho仪表盘看起来类似:

如前所述,我们使用Adobe Flex创建了新的仪表板。 基于Flex的仪表板的代码是使用声明性MXML语言和过程性ActionScript语言编写的,并使用免费的Flex SDK编译为SWF文件。 该SWF文件是Flash Player VM的字节码。 您可以使用新的Adobe Integrated Runtime AIR在浏览器中运行SWF文件,也可以将其作为桌面应用程序运行。 让我们看一下用于创建新仪表盘的源代码。
<?xml version="1.0" encoding="utf-8"?>
 <mx:Application xmlns:mx="http://www.adobe.com/2006/mxml" creationComplete="initApp()" layout="horizontal">
  <mx:Script>
 <![CDATA[
 // import classes used in ActionScript and not used in the MXML
 // ActionScript is code generated from MXML by the free Flex SDK's mxmlc compiler
 // The generated ActionScript can be viewed if you pass mxmlc the -compiler.keep-generated-actionscript argument
 import mx.charts.HitData;
 import mx.collections.ArrayCollection;
 import mx.rpc.events.ResultEvent;

 // Bindable is a metadata / annotation which generates event code so that the variable
 // can be used in an MXML Binding Expression, ie. dataProvider="{territoryRevenue}"
 [Bindable] public var territoryRevenue:ArrayCollection;
 [Bindable] public var productlineRevenue:Object;
 [Bindable] public var topTenCustomersRevenue:Object;

  // Variables in ActionScript have namespaces like in Java.  You can use the typical public,
 // private, and protected namespaces as well as create your own namespaces
 // Object types are specified with a colon character and are optional but recommended.
 private var _selectedTerritory:String = "*";
 private var _selectedProductLine:String = "*";

 // the initApp function is called when the Application's creationComplete event is fired (see the mx:Application tag above
 private function initApp():void
 {
 // initializes our data caches
 productlineRevenue = new Object();
 topTenCustomersRevenue = new Object();

 // initiates the request to the server to get the Sales by Territory data
 // tSrv is defined in MXML below.  It could also have been defined in ActionScript but would have been slightly more verbose tSrv.send();

 // Since the Sales by Product Line and Top Ten Customer Sales depend on the selected territory
 // we make a call to the functions that will fetch the data based on the selected territory (or pull it from cache)
 // in this case the selected territory is "*" or our indicator for all.  When the users selects a new territory
 // these methods will be called again but the selected territory will be different
 updateProductLineRevenue();
 updateTopTenCustomersRevenue();
 }

 // Setter method that causes the data stores for the Sales by Product Line and Top Ten Customer Sales
 // to be updated and the charts to be updated accordingly
 public function set selectedTerritory(territory:String):void
 {
 // update the private backing variable
 _selectedTerritory = territory;

 updateProductLineRevenue();
 updateTopTenCustomersRevenue();
 }

 // Getter method that returns the selected Territory
 // This method has the Bindable metadata / annotation on it so that the selectedTerritory property can
 // be used in a binding expression
 [Bindable] public function get selectedTerritory():String
 {
 return _selectedTerritory;
 }

 // Setter method similar to selectedTerritory but for the selected product line
 public function set selectedProductLine(productLine:String):void
 {
 _selectedProductLine = productLine;

 updateTopTenCustomersRevenue();
 }

 [Bindable] public function get selectedProductLine():String
 {
 return _selectedProductLine;
 }

 // If the data is in cache then just directly update the chart based on the selected territory.
 // If the data is not in cache then assemble the name value pairs that are needed by the
 // web service request, then make the request.
 private function updateProductLineRevenue():void
 {
 if (productlineRevenue[_selectedTerritory] == undefined)
 {
 productlineRevenue[_selectedTerritory] = new ArrayCollection();

 var p:Object = new Object();

 if (_selectedTerritory != "*")
 {
 p.territory = _selectedTerritory;
 }

 plSrv.send(p);
 }
 else
 {
 plPie.dataProvider = productlineRevenue[_selectedTerritory];
 }
 }

 // Similar to updateProductLineRevenue except that both the selected territory and
 // the selected product line determine the data set.
 private function updateTopTenCustomersRevenue():void
 {
 if (topTenCustomersRevenue[_selectedTerritory + '_' + _selectedProductLine] == undefined)
 {
 topTenCustomersRevenue[_selectedTerritory + '_' + _selectedProductLine] = new ArrayCollection();

 var p:Object = new Object();

 if (_selectedTerritory != "*")
 {
 p.territory = _selectedTerritory;
 }

 if (_selectedProductLine != "*")
 {
 p.productline = _selectedProductLine;
 }

 ttcSrv.send(p);
 }
 else
 {
 ttcBar.dataProvider = topTenCustomersRevenue[_selectedTerritory + '_' + _selectedProductLine];
 }
 }

 // This function handles a response from the server to get the Sales by territory.  It reorganizes that data
 // into a format that the chart wants it in.  The tPie chart notices changes to the underlying ArrayCollection
 // that happen inside the for each loop.  When it sees changes it updates it's view of the data.
 private function handleTResult(event:ResultEvent):void
 {
 territoryRevenue = new ArrayCollection();
 tPie.dataProvider = territoryRevenue;

 var hdr:ArrayCollection = event.result.Envelope.Body.ExecuteActivityResponse.swresult['COLUMN-HDR-ROW']['COLUMN-HDR-ITEM'];
 for each (var pl:Object in event.result.Envelope.Body.ExecuteActivityResponse.swresult['DATA-ROW'])
 {
 var spl:Object = new Object();
 spl[hdr[0]] = pl['DATA-ITEM'][0];
 spl[hdr[1]] = pl['DATA-ITEM'][1];
 territoryRevenue.addItem(spl);
 }
 }

 // Similar to handleTResult except that it handles the data for Sales by Product Line
 private function handlePLResult(event:ResultEvent):void
 {
 var hdr:ArrayCollection = event.result.Envelope.Body.ExecuteActivityResponse.swresult['COLUMN-HDR-ROW']['COLUMN-HDR-ITEM'];

 for each (var pl:Object in event.result.Envelope.Body.ExecuteActivityResponse.swresult['DATA-ROW'])
 {
 var spl:Object = new Object();
 spl[hdr[0]] = pl['DATA-ITEM'][0];
 spl[hdr[1]] = pl['DATA-ITEM'][1];
 productlineRevenue[_selectedTerritory].addItem(spl);
 }

 plPie.dataProvider = productlineRevenue[_selectedTerritory];
 }

 // Similar to handleTResult except that it handles the data for Top Ten Customer Sales
 private function handleTTCResult(event:ResultEvent):void
 {
 var hdr:ArrayCollection = event.result.Envelope.Body.ExecuteActivityResponse.swresult['ROW-HDR-ROW'];
 var pl:ArrayCollection = event.result.Envelope.Body.ExecuteActivityResponse.swresult['DATA-ROW'];

 for (var i:int = 0; i < pl.length; i++)
 {
 var spl:Object = new Object();
 spl.name = hdr[i]['ROW-HDR-ITEM'][0];
 spl.sales = pl[i]['DATA-ITEM'];
 topTenCustomersRevenue[_selectedTerritory + '_' + _selectedProductLine].addItemAt(spl,0);
 }

 ttcBar.dataProvider = topTenCustomersRevenue[_selectedTerritory + '_' + _selectedProductLine];
 }

 // This function is called to format the dataToolTips on the tPie chart.
 private function formatTPieDataTip(hitdata:HitData):String
 {
 return "<b>" + hitdata.item.TERRITORY + "</b><br>" + cf.format(hitdata.item.SOLD_PRICE);
 }
 ]]>
 </mx:Script>

 <!-- These HTTP Services communicate via HTTP to a server -->
 <mx:HTTPService id="tSrv" url="http://localhost:8080/pentaho/ServiceAction?solution=samples&path=steel-wheels/homeDashboard&action=Sales_by_Territory.xaction" result="handleTResult(event)"/>
  <mx:HTTPService id="plSrv" url="http://localhost:8080/pentaho/ServiceAction?solution=samples&path=steel-wheels/homeDashboard&action=Sales_by_Productline.xaction" result="handlePLResult(event)"/>
  <mx:HTTPService id="ttcSrv" url="http://localhost:8080/pentaho/ServiceAction?solution=samples&path=steel-wheels/homeDashboard&action=topnmdxquery.xaction" result="handleTTCResult(event)"/>
  <!-- Non-visual component to format currency's correctly.  Used in the formatTPieDataTip function -->
 <mx:CurrencyFormatter id="cf" precision="0"/>

 <!-- Effects used to make the charts more interactive -->
 <mx:SeriesInterpolate id="plEffect"/>
 <mx:SeriesSlide id="ttcSlide" direction="right"/>

 <!-- Stacked vertical layout container -->
 <mx:VBox height="100%" width="40%">
 <!-- Nice box with optional drop shadows, title bars, and control bars -->
 <mx:Panel width="100%" height="100%" title="Revenue By Territory">
 <!-- Pie Chart -->
 <mx:PieChart id="tPie" width="100%" height="100%" showDataTips="true" dataTipFunction="formatTPieDataTip">
 <!-- Sets the itemClick property on the PieChart to the embedded ActionScript code.  We could have also called a function defined above. -->
 <mx:itemClick>
 // calls the appropriate setter method
 selectedTerritory = event.hitData.item.TERRITORY;

 // tells the pie chart to explode the pie wedge the user click on
 var explodeData:Array = [];
 explodeData[territoryRevenue.getItemIndex(event.hitData.item)] = 0.15;
 tPie.series[0].perWedgeExplodeRadius = explodeData;
 </mx:itemClick>
 <!-- Sets the series property on the Pie Chart. -->
 <mx:series>
 <!-- The Pie Series defines how the Pie Chart displays it's data. -->
 <mx:PieSeries nameField="TERRITORY" field="SOLD_PRICE" labelPosition="insideWithCallout" labelField="TERRITORY"/>
 </mx:series>
 </mx:PieChart>
 </mx:Panel>

 <!-- A Binding Expression in the title bar of the Panel uses the Bindable getter for the selectedTerritory property -->
 <mx:Panel width="100%" height="100%" title="Revenue By Product Line (Territory = {selectedTerritory})">
 <mx:PieChart id="plPie" width="100%" height="100%" showDataTips="true">
 <mx:itemClick>
 selectedProductLine = event.hitData.item.PRODUCTLINE;

 var explodeData:Array = [];
 explodeData[productlineRevenue[_selectedTerritory].getItemIndex(event.hitData.item)] = 0.15;
 plPie.series[0].perWedgeExplodeRadius = explodeData;
 </mx:itemClick>
 <mx:series>
 <!-- The showDataEffect on the Series uses Binding to (re)use an effect defined above -->
 <mx:PieSeries nameField="PRODUCTLINE" field="REVENUE" labelPosition="insideWithCallout" showDataEffect="{plEffect}" labelField="PRODUCTLINE"/>
 </mx:series>
 </mx:PieChart>
 </mx:Panel>
 </mx:VBox>
  <mx:Panel width="100%" height="100%" title="Top 10 Customers (Territory = {selectedTerritory} | Product Line = {selectedProductLine})">
 <mx:BarChart id="ttcBar" width="100%" height="100%" showDataTips="true">
 <mx:series>
 <mx:BarSeries xField="sales" showDataEffect="{ttcSlide}"/>
 </mx:series>
 <mx:verticalAxis>
 <mx:CategoryAxis categoryField="name"/>
 </mx:verticalAxis>
 </mx:BarChart>
 </mx:Panel>

 </mx:Application>
下载或查看源代码 。 请注意,该应用程序有两个版本。 pentaho_dashboard_demo.mxml使用伪造的数据集。 pentaho_dashboard.mxml连接到实际的Pentaho服务器以获取其数据。
移植过程
移植到RIA的过程始于设计新接口。 同时,您可能需要弄清楚如何将应用程序的数据和服务公开到新的RIA中。 使用Pentaho,数据和服务已经向我们公开,因此最困难的部分是将数据解析为Flex Charting组件期望的格式。 在某些时候,您可以将后端服务连接到新接口。 让我们更详细地完成这些步骤。
设计新界面
创建新的RIA界面的最佳方法是不考虑如何使现有界面更丰富,而是重新考虑用户希望如何可视化信息并与之交互。 设计师在此过程中可能会非常有帮助。 如果可能的话,让他们很有创造力。 作为开发人员,您可以开始构建原型。 为了有效地做到这一点,您可能需要创建一个模拟数据集。 您可以在Sales_by_Productline.xaction,Sales_by_Territory.xaction和topnmdxquery.xaction文件中看到我们使用的数据集。 在这种情况下,我使模拟数据集看起来像Pentaho公开的Web服务。 这不是必需的,但是一旦我们决定喜欢该设计,就可以更轻松地连接到真实的服务。 通过具有模拟数据集,我们可以更快地迭代设计。
实际上,我们创建的设计几乎与原始仪表板完全一样。 如果我们有一个设计师来帮助我们-我们没有-我们可能会想出一些更有创意的东西。 但是,即使我们是开发人员,我们仍然能够创建更具交互性的仪表板。 我们可以进一步创建一个更丰富的界面,但是对于本示例,我们希望使代码易于阅读和理解。
用于创建UI的代码非常简单。 要创建PieChart,只需添加一些MXML,例如:
<mx:PieChart width="100%" height="100%">
    <mx:series>
       <mx:PieSeries nameField="TERRITORY" field="SOLD_PRICE" labelPosition="insideWithCallout" labelField="TERRITORY"/>
    </mx:series>
 </mx:PieChart>
要添加交互性,您可以向PieChart添加itemClick事件处理程序:
<mx:itemClick>
 selectedTerritory = event.hitData.item.TERRITORY;

  var explodeData:Array = [];
 explodeData[territoryRevenue.getItemIndex(event.hitData.item)] = 0.15;
 tPie.series[0].perWedgeExplodeRadius = explodeData;
 </mx:itemClick>
由于Flex支持属性,因此您在设置selectedTerritory时会像在itemClick事件处理程序中所做的那样导致某些事情发生。 在这种情况下,我们要刷新某些饼图绑定到的数据集:
public function set selectedTerritory(territory:String):void
 {
  _selectedTerritory = territory;

   updateProductLineRevenue();
  updateTopTenCustomersRevenue();
 }
我们还可以非常轻松地向数据集不断变化的图表添加平滑过渡。 首先要做的是添加我们要应用的效果的实例:
<mx:SeriesInterpolate id="plEffect"/>然后,我们可以告诉我们的饼图之一在数据更改时使用该效果。 为此,我们将showDataEffect绑定到我们要使用的效果的实例:
<mx:PieSeries nameField="PRODUCTLINE" field="REVENUE" labelPosition="insideWithCallout" showDataEffect="{plEffect}" labelField="PRODUCTLINE"/>我们还可能需要在数据提示上添加自定义鼠标:
<mx:PieChart id="tPie" width="100%" height="100%" showDataTips="true" dataTipFunction="formatTPieDataTip">名为formatTPieDataTip的dataTipFunction返回一个自定义字符串,以在数据提示中使用:
private function formatTPieDataTip(hitdata:HitData):String
 {
     return "<b>" + hitdata.item.TERRITORY + "<b><br>" + cf.format(hitdata.item.SOLD_PRICE);
 }
我们可以指定许多其他样式来定制应用程序的外观。 这些样式可以作为属性内联指定,也可以在外部CSS文件中指定。
暴露后端
使用Pentaho,可以很容易地找到Web服务并与之交互,这些Web服务公开了仪表板所需的数据。 返回按地区销售的URL(在本地运行时): HERE
一些URL使用参数来确定要返回的数据集。 例如,“十佳客户” Web服务可以采用两个可选参数,区域和产品线,它们确定如何返回信息的子集。
将前钩到后钩
要将前端连接到后端,首先要创建一个HTTPService(如果使用SOAP,则为WebService):
<mx:HTTPService id="tSrv" url="http://localhost:8080/pentaho/ServiceAction?solution=
samples&path=steel-wheels/homeDashboard&action=Sales_by_Territory.xaction"
result="handleTResult(event)"/>
result属性指定了从服务器返回响应时要运行的代码。 在这种情况下,我们只调用一个名为handleTResult的函数,并向其传递单个Event参数。 该功能负责将我们收到的数据转换为图表所需的形式。 无论我们使用的是Charts还是其他组件(例如DataGrid),我们都可能需要对其进行一些调整。 在这种情况下,我们需要对数据进行一些细微调整,然后再将其移交给图表:
private function handleTResult(event:ResultEvent):void
 {
   territoryRevenue = new ArrayCollection();
   tPie.dataProvider = territoryRevenue;

    var hdr:ArrayCollection = event.result.Envelope.Body.ExecuteActivityResponse.swresult['COLUMN-HDR-ROW']['COLUMN-HDR-ITEM'];

   for each (var pl:Object in event.result.Envelope.Body.ExecuteActivityResponse.swresult['DATA-ROW'])
  {
   var spl:Object = new Object();
   spl[hdr[0]] = pl['DATA-ITEM'][0];
   spl[hdr[1]] = pl['DATA-ITEM'][1];\\\\\\\\
   territoryRevenue.addItem(spl);
  }
 }
在此示例中,所有代码都在单个文件中。 在现实世界的应用程序中,我们可能会遵循Model View Controller体系结构将所有内容分解为不同的文件。 我们将在另一时间讨论使用一些经过验证的设计模式构造大型应用程序的主题。 到目前为止,我们已经完成了示例说明中的所有步骤。 从这里一直到本文的结尾,我们将讨论使用Adobe Flex进行RIA的一些有趣的方面,并提供指向该示例应用程序可以完成的准备工作的指针。
这个例子有什么好处?
该示例Swift说明了对于传统的老式Web应用程序而言,更丰富和更具交互性的用户界面的重要性。 该应用程序的优点在于,它无需进行大量重构即可为现有应用程序提供出色的接口。 这种便利的部分原因可以归因于Pentaho将其服务器端调用公开为Web服务端点,而部分则可以归因于Flex在其组件和数据绑定模型中优雅地使用这些服务的能力。
该示例还表明,谨慎混合和匹配技术。 一个好的,健壮的Java服务器应用程序可以与丰富的Flex接口有效地挂钩,以创建引人注目的应用程序。 这是一个巨大的价值主张,这个例子有望将其付诸实践。
该应用程序的另一个方面是,它通过实际和有效的代码显示了使用ActionScript和MXML构建Flex应用程序有多么容易。 对于大多数熟悉Java和XML的人来说,语法和语义非常熟悉。 是不是
缺少什么以及如何弥合差距?
该示例不是可用于生产的软件。 更关心的是作为一个简单的原型。 但是,将Pentaho Web服务调用抽象为ActionScript库可能需要一点努力,这可能是构建健壮的应用程序的一个好步骤。 正在建立此类库的开放源代码工作正在进行中。 该示例采用的是过程式方法,很少使用面向对象的构造。 使用Model View Controller架构模式,对接口进行编程以及适当地使用继承和多态性将创建可维护且简洁的应用程序。 在示例应用程序中,我们复制了外观。 理想情况下,我们应该根据交互需求创建一个全新的界面,然后将可视组件绑定到Web服务组件。 为了创建可用于生产的应用程序,我们应该在这种努力上投入时间和精力。
进一步阅读
该示例实际上只是您可以使用Rich Internet Applications进行操作的冰山一角。 我们可以做的一项改进就是对图表的深入分析进行更有意义的过渡。 Ely Greenfield用说明和代码创建了一个很棒的演示,该说明和代码显示了如何使用Flex Charts进行深入分析。 有关详细信息和演示,请参见他的博客 。 我们使用Flex 2来构建此演示,但是Flex 3 Charting组件中有很多新功能。 您可以在此处和此处阅读有关这些功能的更多信息。 如果您想了解有关Flex编程的更多信息,请访问flex.org和learning.adobe.com 。


 3万+
3万+


 被折叠的 条评论
为什么被折叠?
被折叠的 条评论
为什么被折叠?
 到【灌水乐园】发言


