


Operating systems did jobs by running processes and tasks. One of the primary duties of an operating system is the management of processes. All operating systems have a different type of task manager. Windows have built-in task manager maned Task Manager . In this tutorial, we will look detailed about Windows Task Manager.
操作系统通过运行流程和任务来完成工作。 操作系统的主要职责之一是进程管理。 所有操作系统都有不同类型的任务管理器。 Windows内置了任务管理器,可以执行任务管理Task Manager 。 在本教程中,我们将详细介绍Windows Task Manager。
启动任务管理器 (Start Task Manager)
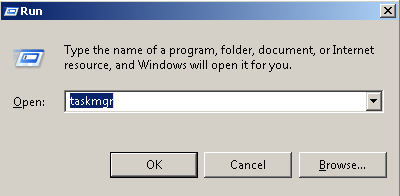
There are different ways to start Task Manager. One way is using Run command box providing taskmgr like below.
有不同的方法来启动任务管理器。 一种方法是使用Run命令框,如下所示提供taskmgr 。
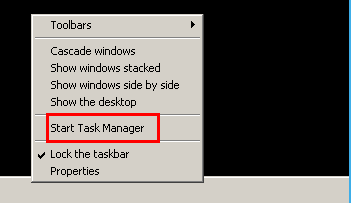
Another way is Right click to Task Bar and click to the Task Manager .
另一种方法是Right单击“任务栏”,然后单击“ Task Manager 。
列出申请(List Applications)
Applications tab provides currently running User space graphical applications. In a system actually there a lot of applications running but only some of them are GUI applications directly interacted by the user. This tab lists these applications. We can see from the example that the user is currently running Mozilla Firefox and Google Chrome .
应用程序选项卡提供当前正在运行的用户空间图形应用程序。 实际上,在一个系统中,有许多应用程序正在运行,但是只有其中一些是用户直接交互的GUI应用程序。 此选项卡列出了这些应用程序。 从示例中我们可以看到用户当前正在运行Mozilla Firefox和Google Chrome 。

列出流程(List Processes)
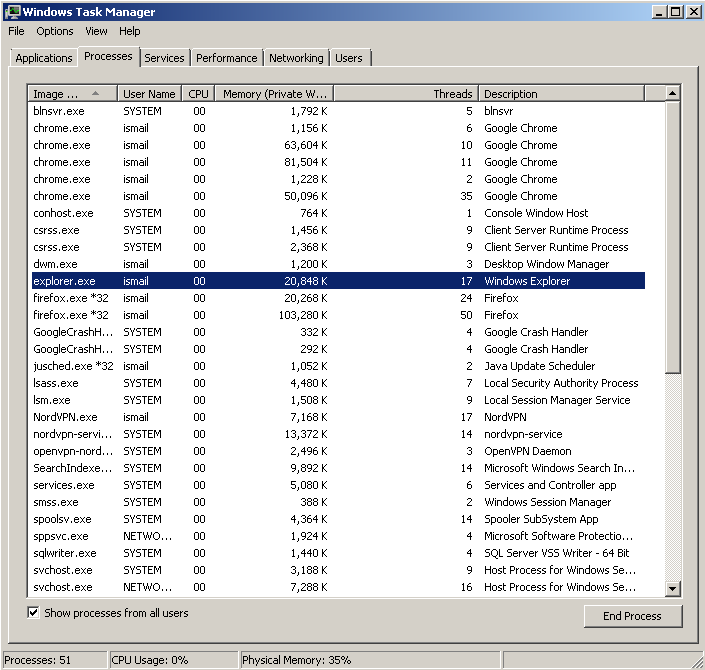
Processes tab will list all processes that are running on the system. Some processes may be running on the background. There are following information about processes
进程选项卡将列出系统上正在运行的所有进程。 某些进程可能正在后台运行。 以下是有关流程的信息
Image Namecolumns show processes executable name.Image Name列显示进程的可执行文件名称。User Namecolumn shows the user who owns and started the process.User Name列显示拥有并启动该过程的用户。CPUcolumn shows the CPU usage percentage of the process.CPU列显示进程的CPU使用率百分比。Memorycolumns show the memory usage of the process.Memory列显示进程的内存使用情况。Descriptioncolumn show more detail about the process.Description列显示有关该过程的更多详细信息。
添加新列(Add New Column)
We can also add a new column to get different information about processes. In order to add column we need to list available columns with View -> Select Columns... like below.
我们还可以添加新列以获取有关流程的不同信息。 为了增加专栏中,我们需要列出可用列有View - > Select Columns...像下面。
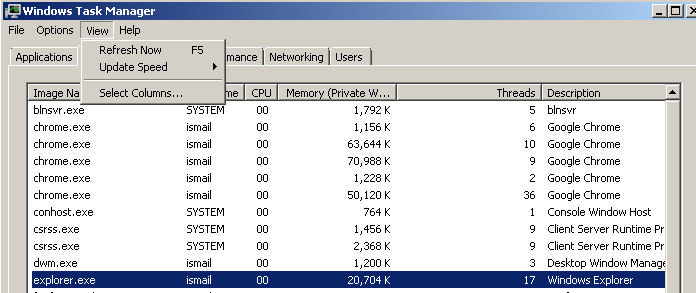
After that, windows like below will be shown.
之后,将显示如下所示的窗口。
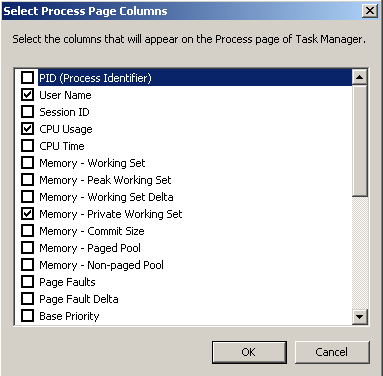
In this window, we can select which columns we want to list just by checking. Important of the columns are;
在此窗口中,我们可以通过检查选择要列出的列。 重要的列是;
- CPU Time CPU时间
- Threads线程数
- I/O ReadsI / O读取
- I/O WritesI / O写入
- Command Line命令行
显示所有用户的进程(Show Processes From All Users)
By default task manager will only list processes owned by the current user. In our example the current user is ismail . But we may need other user processes to list. This can be done with the checkbox below the left corner. This will list all users like SYSTEM . NETWORK , LOCAL SERVICE and other normal users.
默认情况下,任务管理器将仅列出当前用户拥有的进程。 在我们的示例中,当前用户是ismail 。 但是我们可能需要其他用户进程来列出。 可以使用左下角的复选框来完成此操作。 这将列出所有用户,例如SYSTEM 。 NETWORK , LOCAL SERVICE和其他普通用户。
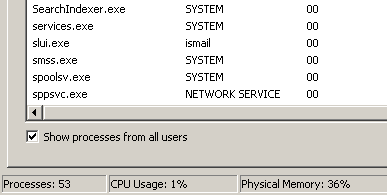
There is also information about total process numbers, total CPU usage, and memory usage.
还提供有关进程总数,CPU总使用率和内存使用情况的信息。
服务标签 (Services Tab)
Services or daemon generally works background. Services do not need any GUI. Services also run always not like a process. Because the process starts and ends in some time. We can list services with Task Manager in the Services tab
服务或守护程序通常在后台运行。 服务不需要任何GUI。 服务也总是不像进程那样运行。 因为该过程在某个时间开始和结束。 我们可以使用“任务管理器”在“ Services选项卡中列出服务

Namecolumn shows the name of the serviceName列显示服务的名称PIDcolumn shows the process ID of the servicePID列显示服务的进程IDDescriptioncolumn shows more information about the serviceDescription栏显示有关服务的更多信息Statuscolumn shows the current working condition likeStoppedorRunningof serviceStatus列显示当前的工作状态,例如“已Stopped或“正在Running服务”Groupcolumn shows a related group of the serviceGroup列显示服务的相关组
效果标签(Performance Tab)
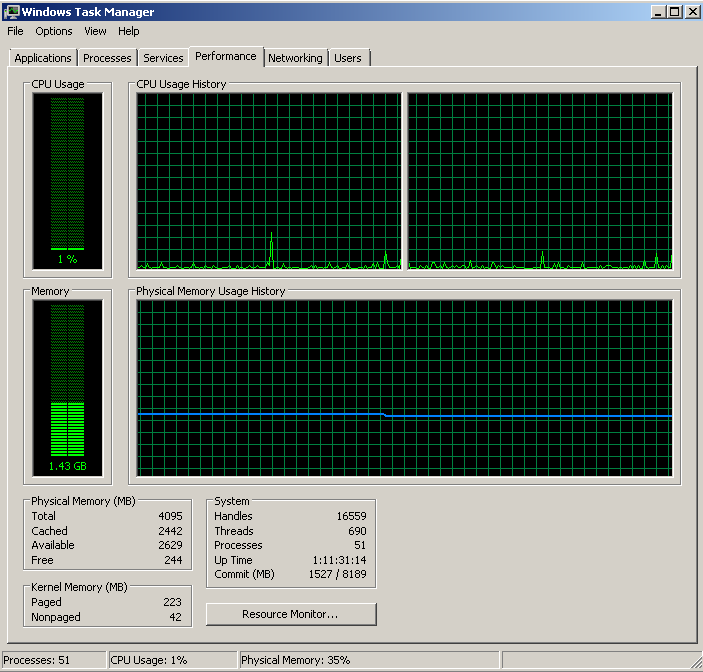
Task Manager also provides information about the system resources. Task Manager provides load information about CPU, Memory. There are the following information;
任务管理器还提供有关系统资源的信息。 任务管理器提供有关CPU,内存的负载信息。 有以下信息;
- CPU Usage CPU使用率
- CPU Usage HistoryCPU使用率历史
Physical Memory
物理内存
- Total总
- Cached已缓存
- Available可用的
- Free自由
- Threads线程数
- Process处理
- Uptime正常运行时间
联网(Networking)
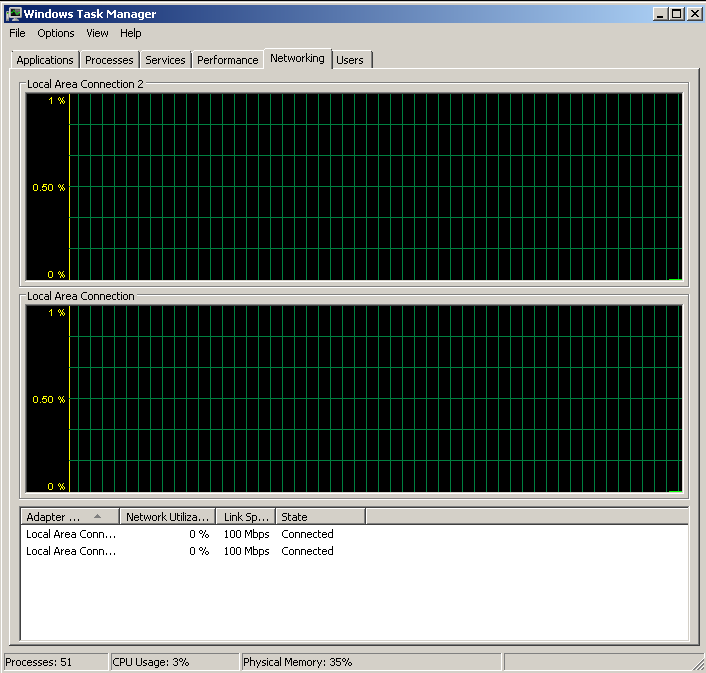
In the networking tab, the network interfaces listed as graphs and their network speed and usage percentage are shown. There is also information like network interface connection status, link speed
在网络选项卡中,显示了以图形形式列出的网络接口以及它们的网络速度和使用百分比。 还有诸如网络接口连接状态,链接速度之类的信息
用户数(Users)
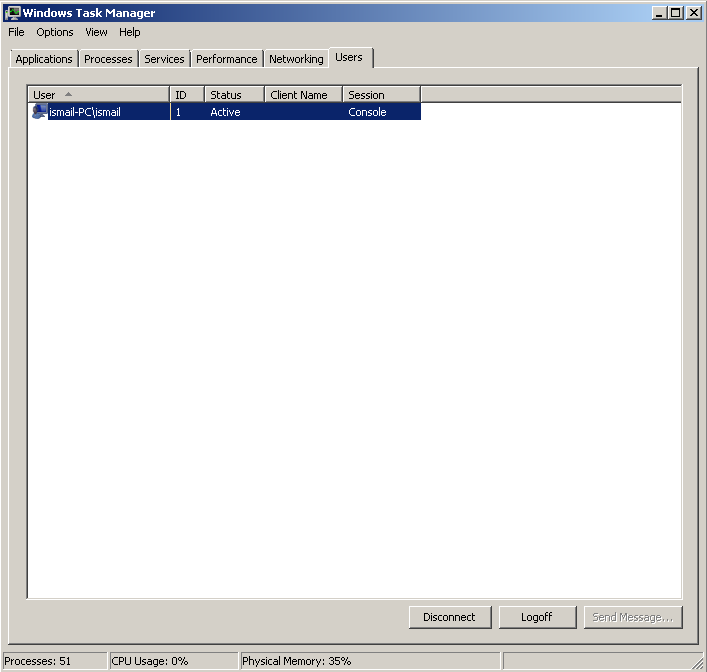
In the User tab currently, connected users are shown. In this example, we see that the use named ismail is connected to the local system with the ID 1 and session type is console which means a local desktop session.
当前在“用户”选项卡中,显示了已连接的用户。 在此示例中,我们看到名为ismail的使用以ID 1连接到本地系统,会话类型为console,这意味着本地桌面会话。
Usercolumn shows account computer and nameUser列显示帐户计算机和名称IDcolumns show user connection IDID列显示用户连接IDStatuscolumn shows current user status whether is connected or notStatus列显示当前用户状态(是否已连接)Sessioncolumns show where the user connected. This can beconsoleorterminalSession列显示用户连接的位置。 这可以是console或terminal
所有方式都在顶部(All ways On Top)
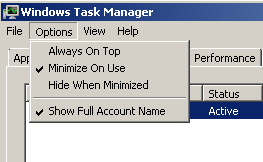
If we want to Task Manager window always stay on top we can set this from Options a menu like below. This will always show the Task Manager on the top of the open windows and applications even they are opened later than Task Manager.
如果我们希望“任务管理器”窗口始终位于顶部,则可以从“ Options菜单(如下所示)中进行设置。 这将始终在打开的窗口和应用程序的顶部显示任务管理器,即使它们在任务管理器之后打开也是如此。


 7013
7013

 被折叠的 条评论
为什么被折叠?
被折叠的 条评论
为什么被折叠?
 到【灌水乐园】发言


