


TensorFlow-线性回归 (TensorFlow - Linear Regression)
In this chapter, we will focus on the basic example of linear regression implementation using TensorFlow. Logistic regression or linear regression is a supervised machine learning approach for the classification of order discrete categories. Our goal in this chapter is to build a model by which a user can predict the relationship between predictor variables and one or more independent variables.
在本章中,我们将重点介绍使用TensorFlow进行线性回归的基本示例。 Logistic回归或线性回归是一种有监督的机器学习方法,用于对离散量类别进行分类。 本章的目标是建立一个模型,用户可以通过该模型来预测预测变量和一个或多个自变量之间的关系。
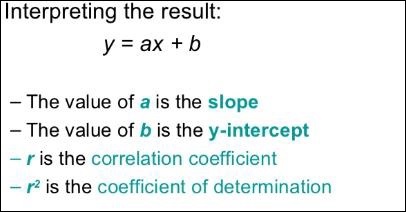
The relationship between these two variables is cons −idered linear. If y is the dependent variable and x is considered as the independent variable, then the linear regression relationship of two variables will look like the following equation −
这两个变量之间的关系被认为是线性的。 如果y是因变量且x被视为自变量,则两个变量的线性回归关系将类似于以下方程式-
Y = Ax+b
We will design an algorithm for linear regression. This will allow us to understand the following two important concepts −
我们将设计用于线性回归的算法。 这将使我们能够理解以下两个重要概念-
- Cost Function 成本函数
- Gradient descent algorithms 梯度下降算法
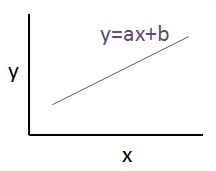
The schematic representation of linear regression is mentioned below −
线性回归的示意图表示如下-
The graphical view of the equation of linear regression is mentioned below −
下面提到线性回归方程的图形视图-
设计线性回归算法的步骤 (Steps to design an algorithm for linear regression)
We will now learn about the steps that help in designing an algorithm for linear regression.
现在,我们将学习有助于设计线性回归算法的步骤。
第1步 (Step 1)
It is important to import the necessary modules for plotting the linear regression module. We start importing the Python library NumPy and Matplotlib.
导入用于绘制线性回归模块的必要模块很重要。 我们开始导入Python库NumPy和Matplotlib。
import numpy as np
import matplotlib.pyplot as plt
第2步 (Step 2)
Define the number of coefficients necessary for logistic regression.
定义逻辑回归所需的系数数。
number_of_points = 500
x_point = []
y_point = []
a = 0.22
b = 0.78
第三步 (Step 3)
Iterate the variables for generating 300 random points around the regression equation −
迭代变量以围绕回归方程生成300个随机点-
Y = 0.22x+0.78
Y = 0.22x + 0.78
for i in range(number_of_points):
   x = np.random.normal(0.0,0.5)
   y = a*x + b +np.random.normal(0.0,0.1) x_point.append([x])
   y_point.append([y])
第4步 (Step 4)
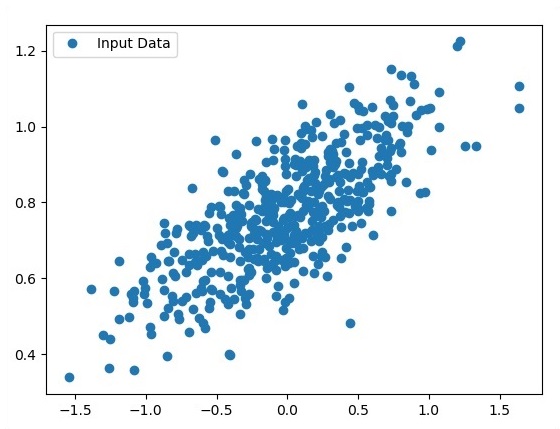
View the generated points using Matplotlib.
使用Matplotlib查看生成的点。
fplt.plot(x_point,y_point, 'o', label = 'Input Data') plt.legend() plt.show()
The complete code for logistic regression is as follows −
逻辑回归的完整代码如下-
import numpy as np
import matplotlib.pyplot as plt

number_of_points = 500
x_point = []
y_point = []
a = 0.22
b = 0.78

for i in range(number_of_points):
   x = np.random.normal(0.0,0.5)
   y = a*x + b +np.random.normal(0.0,0.1) x_point.append([x])
   y_point.append([y])

plt.plot(x_point,y_point, 'o', label = 'Input Data') plt.legend()
plt.show()
The number of points which is taken as input is considered as input data.
被视为输入的点数被视为输入数据。
翻译自: https://www.tutorialspoint.com/tensorflow/tensorflow_linear_regression.htm


 294
294


 被折叠的 条评论
为什么被折叠?
被折叠的 条评论
为什么被折叠?
 到【灌水乐园】发言


