


In order to properly diagnose start time performance, you can track metrics that show how long it takes your application to start.
Time to initial display
From Android 4.4 (API level 19), logcat includes an output line containing a value called Displayed. This value represents the amount of time elapsed between launching the process and finishing drawing the corresponding activity on the screen. The elapsed time encompasses the following sequence of events:
- Launch the process.
- Initialize the objects.
- Create and initialize the activity.
- Inflate the layout.
- Draw your application for the first time.
The reported log line looks similar to the following example:
ActivityManager: Displayed com.android.myexample/.StartupTiming: +3s534ms
If you’re tracking logcat output from the command line, or in a terminal, finding the elapsed time is straightforward. To find elapsed time in Android Studio, you must disable filters in your logcat view. Disabling the filters is necessary because the system server, not the app itself, serves this log.
Once you’ve made the appropriate settings, you can easily search for the correct term to see the time. Figure 2 shows how to disable filters, and, in the second line of output from the bottom, an example of logcat output of the Displayed time.
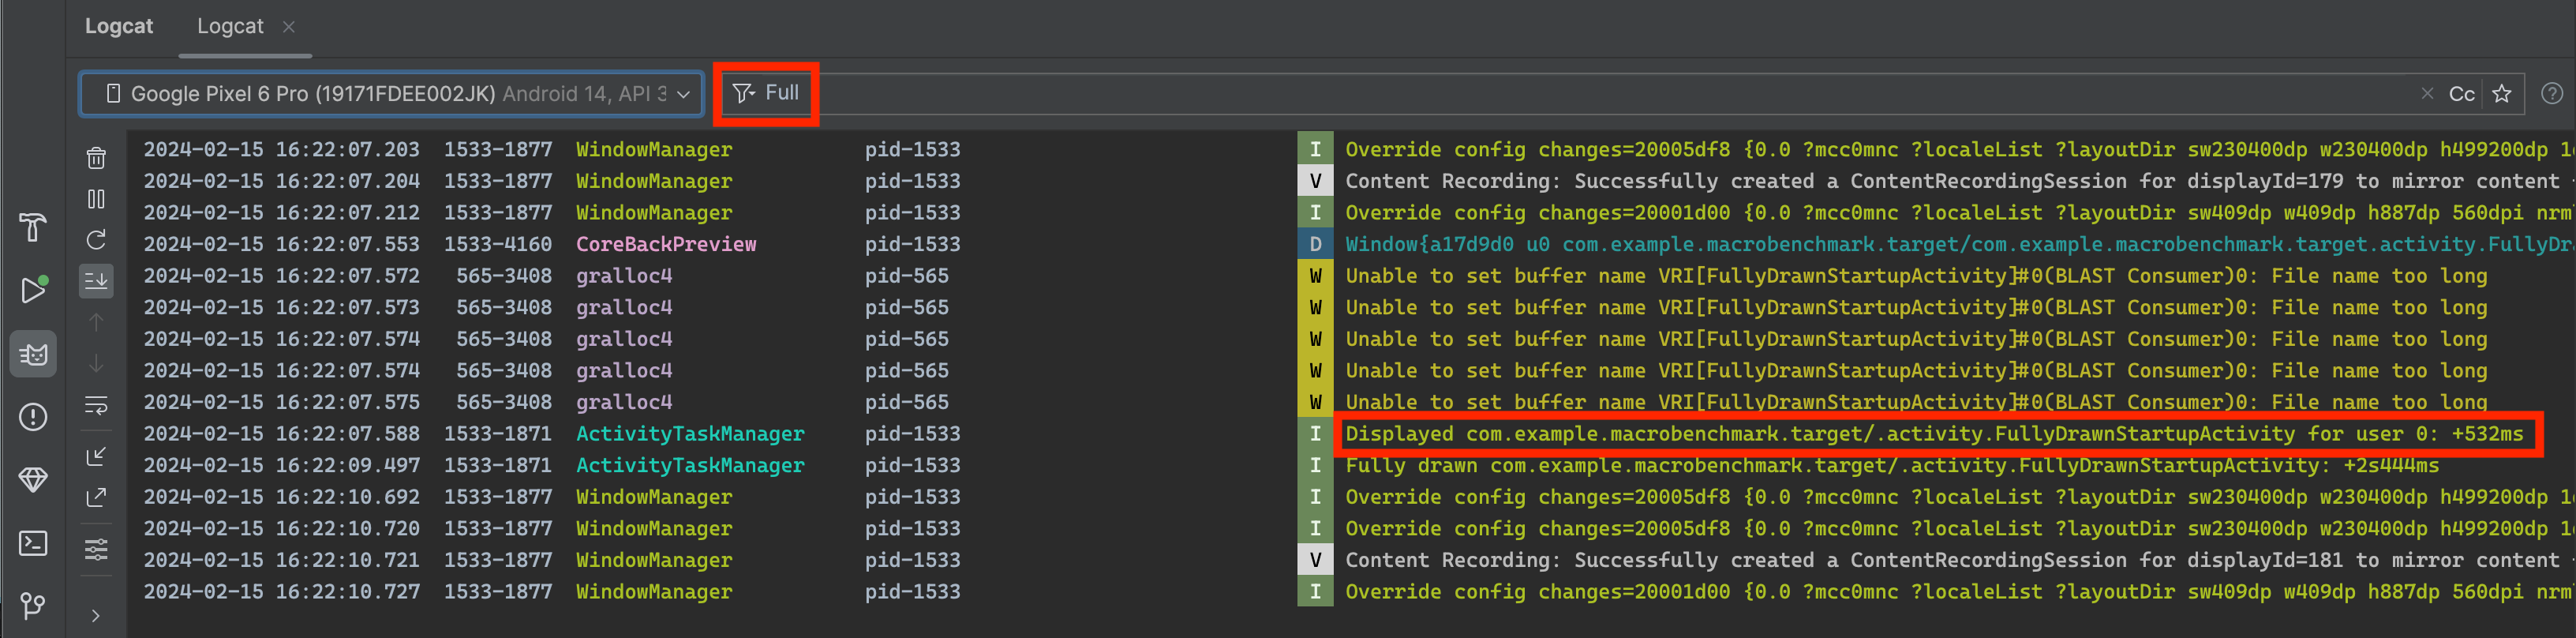
Figure 2. Disabling filters, and finding the Displayed value in logcat.
The Displayed metric in the logcat output does not necessarily capture the amount of time until all resources are loaded and displayed: it leaves out resources that are not referenced in the layout file or that the app creates as part of object initialization. It excludes these resources because loading them is an inline process, and does not block the app’s initial display.


 96
96

 被折叠的 条评论
为什么被折叠?
被折叠的 条评论
为什么被折叠?
 到【灌水乐园】发言


