折线图与面积图
- 单线图、多线图
- 面积图、堆叠面积图
import numpy as np
import pandas as pd
import matplotlib.pyplot as plt
%matplotlib inline
import warnings
warnings.filterwarnings('ignore')
from bokeh.io import output_notebook
output_notebook()
from bokeh.plotting import figure,show
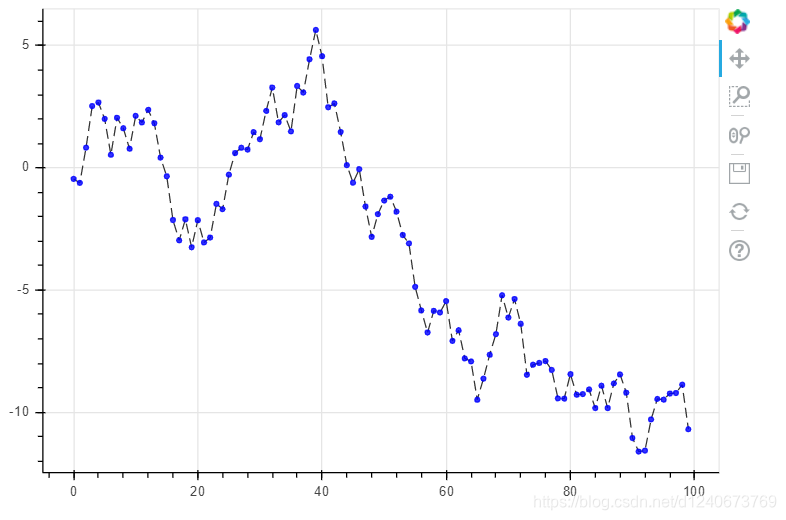
1、折线图 - 单线图
from bokeh.models import ColumnDataSource
df = pd.DataFrame({'value':np.random.randn(100).cumsum()})
df.index.name='index'
df.head()
source = ColumnDataSource(data=df)
p = figure(plot_width=600, plot_height=400)
p.line(x='index', y='value', source=source,
line_width=1, line_alpha=0.8, line_color='black', line_dash=[8,4]
)
p.circle(x='index', y='value', source=source, size=4, color='blue', alpha=0.8)
show(p)
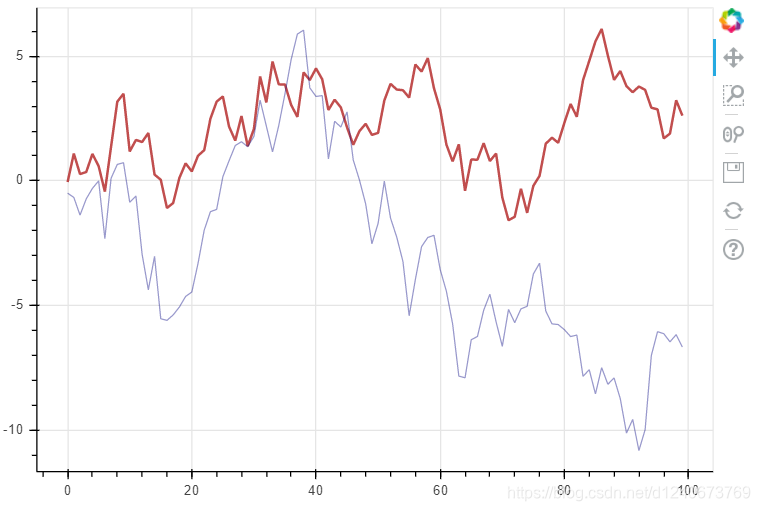
2、折线图 - 多线图:multi_line()
df = pd.DataFrame({'A': np.random.randn(100).cumsum(), 'B': np.random.randn(100).cumsum()})
p = figure(plot_width=600, plot_height=400)
p.multi_line([df.index, df.index],
[df['A'], df['B']],
color=['firebrick', 'navy'],
alpha=[0.8, 0.4],
line_width=[2,1],
)
show(p)
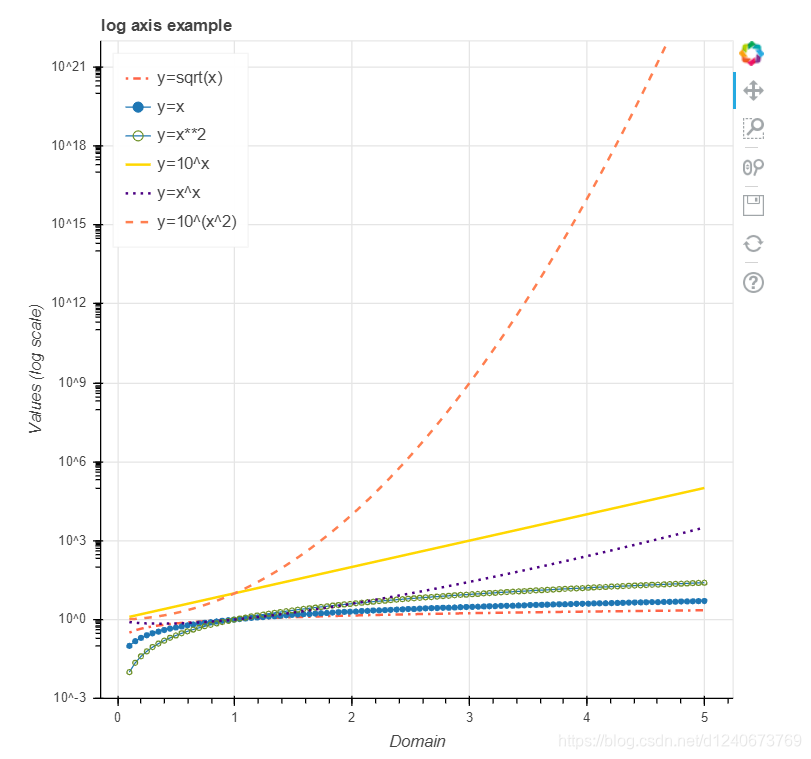
3、折线图 - 多线图:多个line
x = np.linspace(0.1, 5, 100)
p = figure(title="log axis example", y_axis_type="log", y_range=(0.001, 10**22))
p.line(x, np.sqrt(x), legend_label="y=sqrt(x)", line_color="tomato", line_dash="dotdash", line_width=2)
p.line(x, x, legend_label='y=x')
p.circle(x, x, legend_label='y=x')
p.line(x, x**2, legend_label='y=x**2')
p.circle(x, x**2, legend_label='y=x**2', fill_color=None, line_color="olivedrab")
p.line(x, 10**x, legend_label="y=10^x", line_color='gold', line_width=2)
p.line(x, x**x, legend_label="y=x^x", line_color='indigo', line_width=2, line_dash="dotted")
p.line(x, 10**(x**2), legend_label="y=10^(x^2)", line_color='coral', line_width=2, line_dash="dashed")
p.legend.location='top_left'
p.xaxis.axis_label='Domain'
p.yaxis.axis_label='Values (log scale)'
show(p)
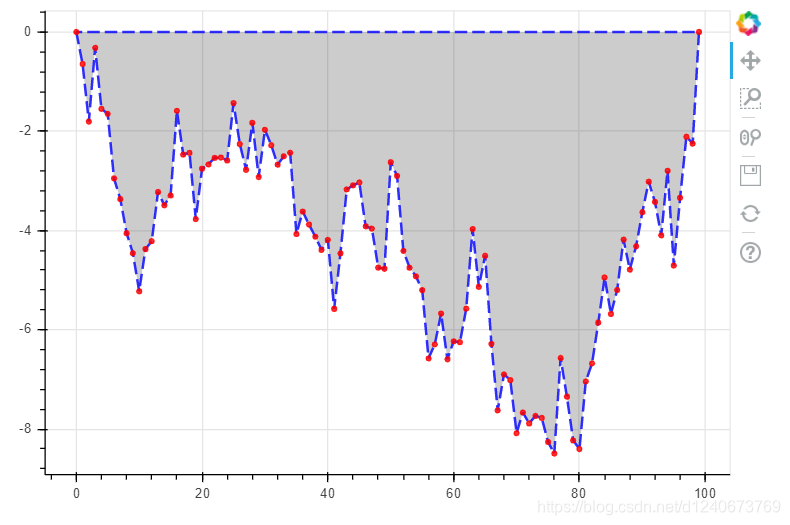
4、面积图 - 单维度面积图
s = pd.Series(np.random.randn(100).cumsum())
s.iloc[0]=0
s.iloc[-1]=0
p = figure(plot_width=600, plot_height=400)
p.patch(s.index, s.values,
line_width=2, line_alpha=0.8, line_color='blue', line_dash=[10,4],
fill_color='black', fill_alpha=0.2
)
p.circle(s.index, s.values, size=4, color='red', alpha=0.8)
show(p)
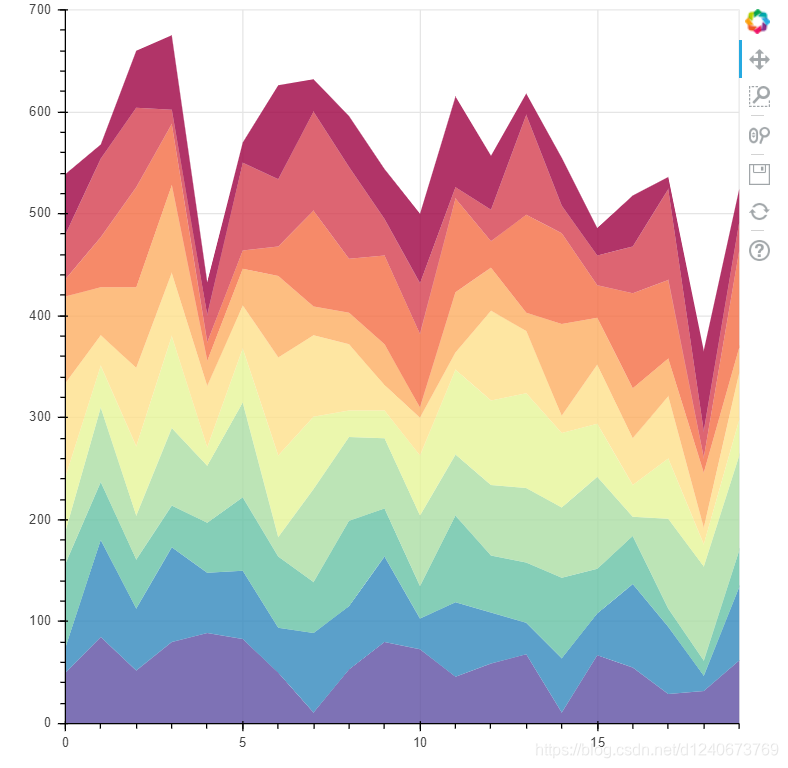
5、面积图 - 面积堆叠图
from bokeh.palettes import brewer
N=20
cats=10
rng=np.random.RandomState(2)
df = pd.DataFrame(rng.randint(10,100, size=(N, cats))).add_prefix('y')
df.head()
df_top=df.cumsum(axis=1)
df_bottom=df_top.shift(axis=1).fillna({'y0':0})[::-1]
df_stack=pd.concat([df_bottom, df_top], ignore_index=True)
colors = brewer['Spectral'][df_stack.shape[1]]
x = np.hstack((df.index[::-1], df.index))
p = figure(x_range=(0, N-1), y_range=(0,700))
p.patches([x]*df_stack.shape[1],
[df_stack[c].values for c in df_stack],
color=colors, alpha=0.8, line_color=None
)
show(p)


 580
580


 被折叠的 条评论
为什么被折叠?
被折叠的 条评论
为什么被折叠?
 到【灌水乐园】发言


