


 本文介绍如何使用C++调用Python代码,利用Python的matplotlib库将C++处理的图像数据转换并展示为三维立体图。通过具体步骤和代码示例,展示了从初始化Python环境到调用Python函数显示3D图像的全过程。
- 由于以前做的很多图形算法,都是用c++编写,算法精炼,速度快。
- 有时候这些算法需要用3维图展示效果,但c++的opencv里没有很方便的3维立体图方式。
- python的中有各种图形库,可以很方便的展示3维立体图。(python比matlab显示立体图更加快捷)
- 可以用c++中调用python代码,实现3维图形展示。
(源码下载地址:https://download.csdn.net/download/dcx_dcx/12171250)
1. 初始化python:
void InitPython()
{
	Py_Initialize(); /*初始化python解释器,告诉编译器要用的python编译器*/
	PyRun_SimpleString("import sys"); //以下操作是路径设置,
	PyRun_SimpleString("sys.argv = ['python.py']"); //添加
	PyRun_SimpleString("sys.path.append('..')");
	PyRun_SimpleString("sys.path.append('.')");
	PyRun_SimpleString("sys.path.append('../pythontest')"); //这个python文件的目录路径
	PyRun_SimpleString("sys.path.append('./')");
    //以下调用很重要,否则转换中会出现异常
    if (_import_array() < 0)
    {
        PyErr_Print();
        PyErr_SetString(PyExc_ImportError, "numpy.core.multiarray failed to import");
    }
}
2.读取图片:
	Mat matpic;
	matpic = imread("p1.jpg", IMREAD_GRAYSCALE); //读取图片为单通道,灰度图
3.调用python代码,3维图立体展示灰度图片
//下面将Mat 图片,用python的matplotlib,显示为3d图
void TestF6(Mat &matbuf){

    PyObject* pModule = NULL;
    PyObject* pFunc = NULL;

    pModule = PyImport_ImportModule("demo6");//注意文件名字大小写
    PyObject* pyFunc_printList = PyObject_GetAttrString(pModule, "show3DList");//获取函数名称

    int w0, h0;
    w0 = matbuf.cols; //图片的列(宽)
    h0 = matbuf.rows; //图片的行(高)
    uchar* pbuf;
    pbuf = matbuf.data;

    PyObject* pArgs = PyTuple_New(1);
    npy_intp dims[2];
    dims[0] = h0; //定义list的shape
    dims[1] = w0;
    int ND = 2;//指明list的维度
    PyObject* pPyArray = PyArray_SimpleNewFromData(ND, dims, NPY_UBYTE, pbuf); //指明list的维度,shape,数量类型,缓冲区
    PyTuple_SetItem(pArgs, 0, pPyArray);//变量转换
    PyEval_CallObject(pyFunc_printList, pArgs);//函数调用
}
4. python 函数代码:demo6.py
def show3DList(lis):
Z = np.array(lis) #list转换成np的array
yn=Z.shape[0] #读取行
xn=Z.shape[1] #读取列
x = np.arange(0.0,xn,1.0) #方格X方向序列
y = np.arange(0.0,yn,1.0) #方格y方向序列
X, Y = np.meshgrid(x, y) #形成方格X,Y坐标
fig = plt.figure()
ax = Axes3D(fig) #定义3维图显示界面
#开始显示
ax.plot_surface(X, Y, Z, cmap="rainbow", linewidth=0, antialiased=False)
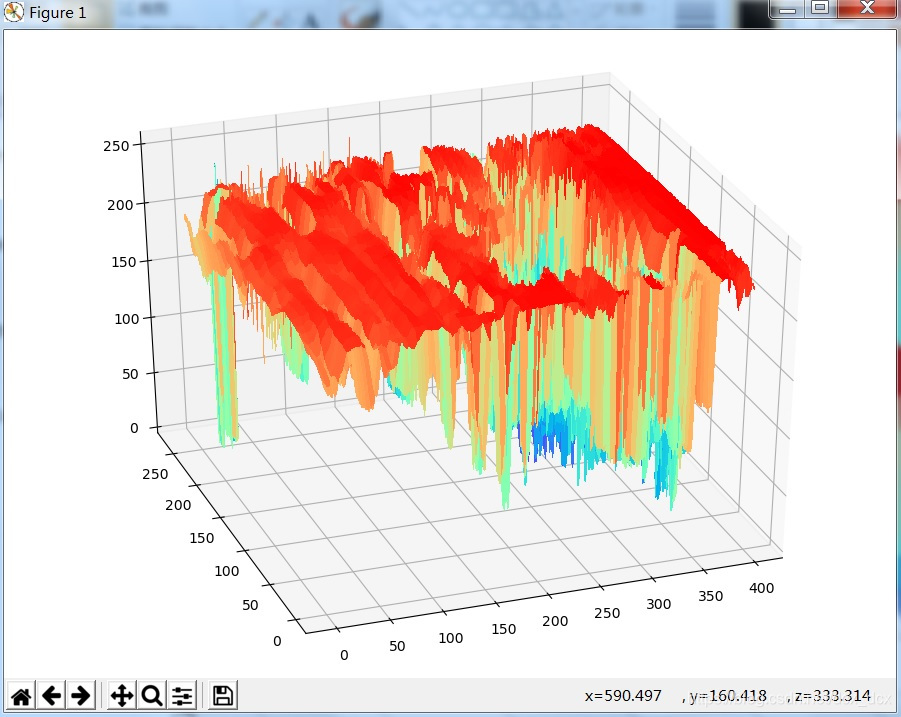
plt.show()5 .效果:

转换成3d图片:


 被折叠的 条评论
为什么被折叠?
被折叠的 条评论
为什么被折叠?
 到【灌水乐园】发言


