


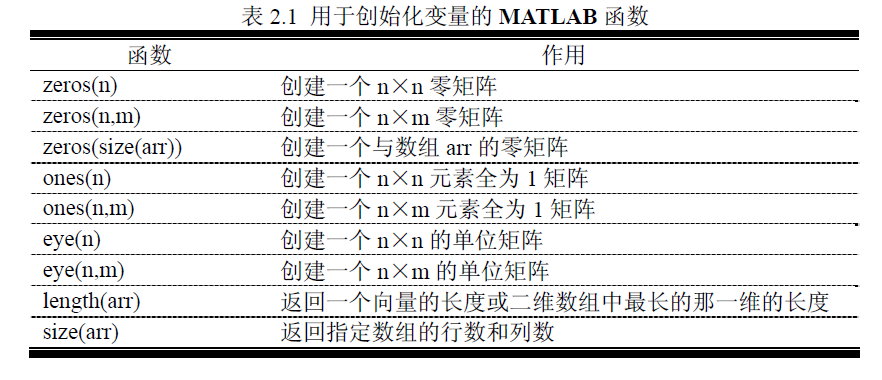
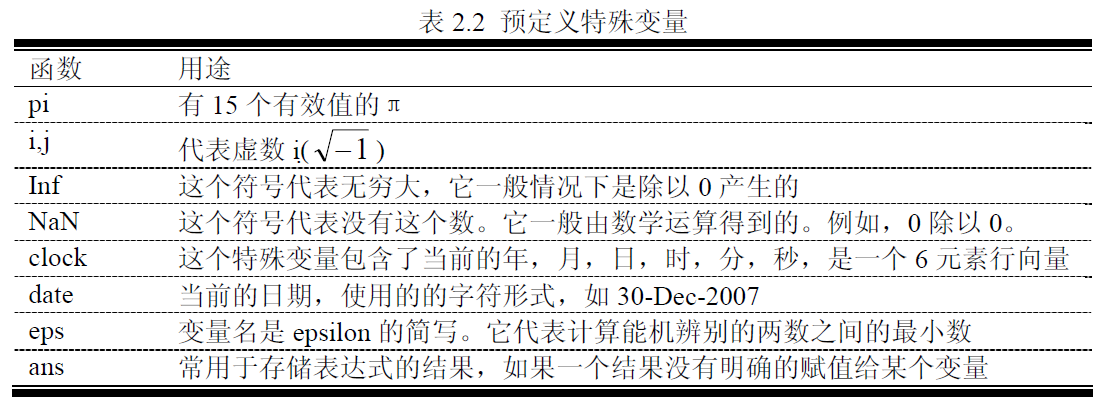
:matlab,数据类型(数值,字符串),选择结构,循环接口,函数,字符串函数和矩阵,文件操作
clc
clf
clear
abort
!
diary filename->diary on->diary off
which filename
editpath
a=[0 1+7]
b=[a(2) 7 a]
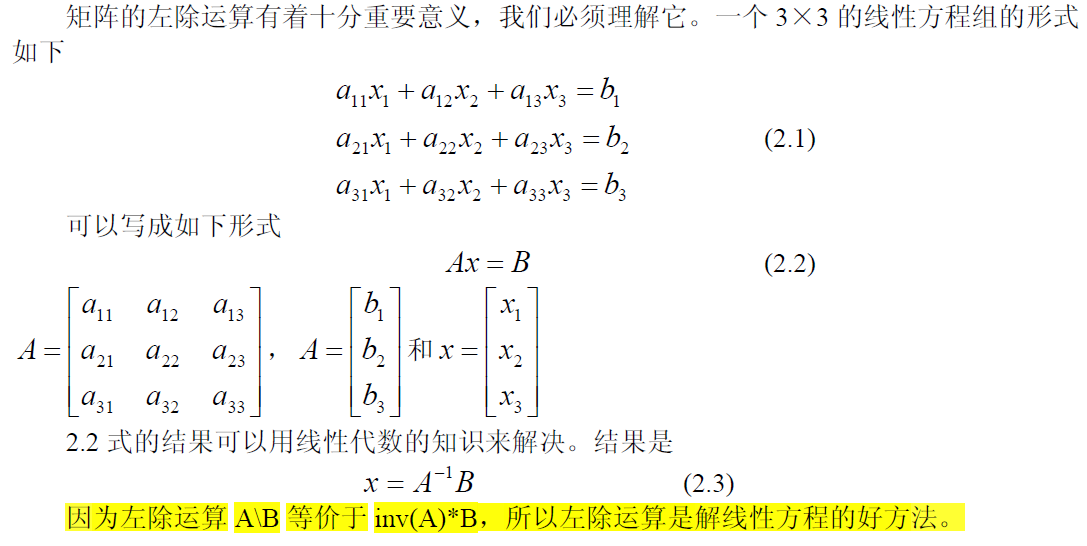
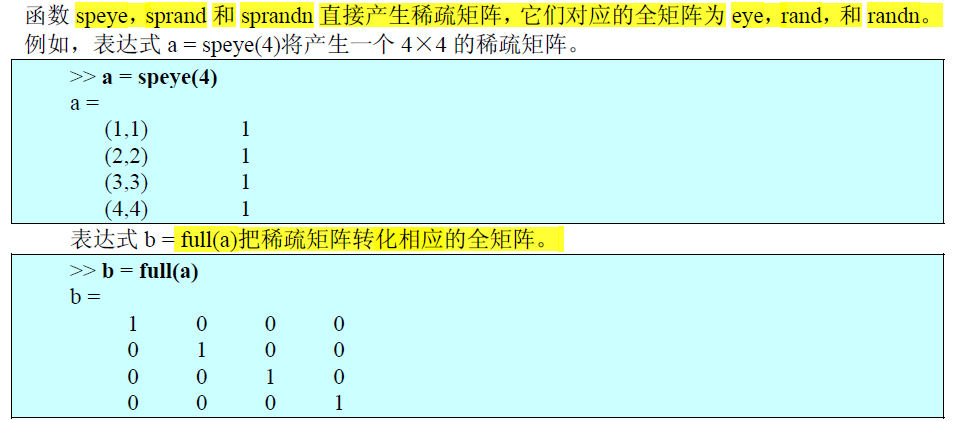
定义了数组a=[0 8]和数组b=[8 7 0 8].
d = [1 2]
d(4) = 4
d的值为[1 2 0 4]
first:incr:last
Angles = (.01:.01:1)
Angles = [.01:.01:1]
Angles = .01:.01:1
g = [1:4]';
h = [g' g']
in2 = input('enter data:','s') 字符串
c(:,:,1)=[1,2,3;4,5,6];
c(:,:,2)=[1,2,3;4,5,6];
whos c
arr2 = [1 2 3; -2 -3 -4;3 4 5]
子数组arr2(1,:)为[1 2 3],子数组arr2(:,1:2:3)为第一列,第三列
arr4 = [1 2 3 4;5 6 7 8;9 10 11 12]
arr4(2:end,2:end)
倒过来处理,逆序

str=['the value of pi=' num2str(pi)];
disp(str);
fprintf('The value of pi is %6.2f \n',pi)
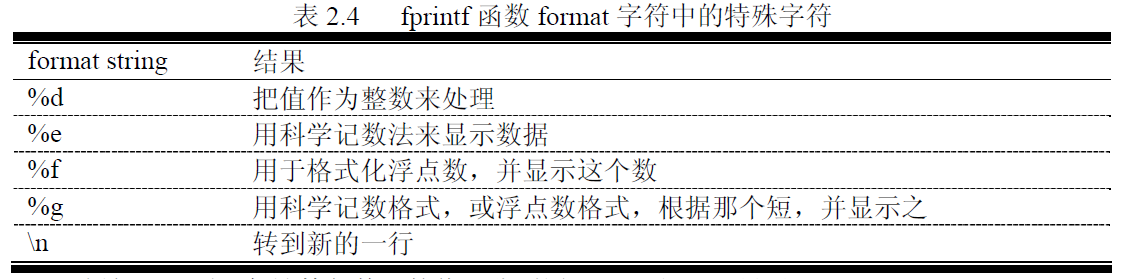
fprintf 函数只能复数的实部,所以在有复数参加或产生的计算中,可能产生错误的结
果。
save duantest.dat x -ascii
load duantest.dat
.mat
radius = input('Enter circle radius:\n');
area = pi * radius^2;
str = ['The area is ' num2str(area)]; //类型转换
disp(str);
``
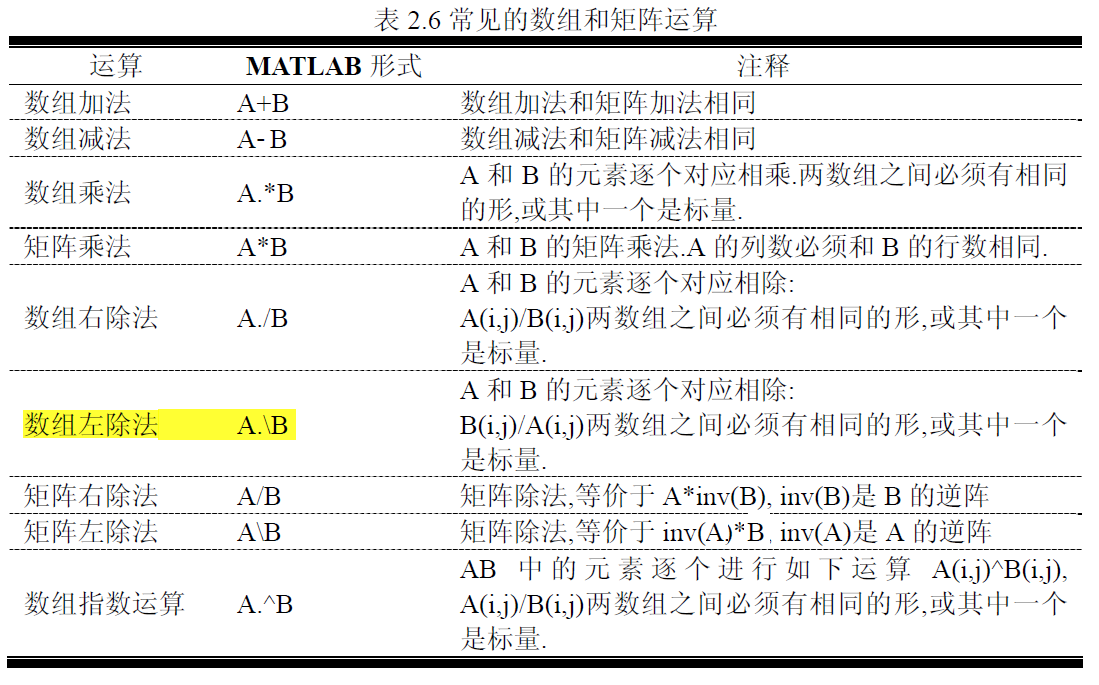
在你的
MATLAB
代码中,仔细区分数组运算和矩阵运算。数组乘法和矩阵乘法极易混
淆。
x=[0 pi/2 3*pi/2 2*pi]
y=sin(x)
x = 0:1:10;
y = x.^2-10*x+15;
plot(x,y);

x=0:1:10;
y=x.^2-10*x+15;
plot(x,y);
title ('Plot of y=x.^2-10*x+15');
xlabel ('x');
ylabel ('y');
grid on;
给图增加标题和坐标轴标签将会用到title, xlabel, ylable 函数。调用每个函数时将会有一
个字符串,这个字符串包含了图象标题和坐标轴标签的信息。用grid 命令可使网格线出现
或消失在图象中,grid on 代表在图象中出现网格线,grid off 代表去除网格线。例如下面的
语句将会产生带有标题,标签和网格线的函数图象
x = 0:pi/100:2*pi;
y1 = sin(2*x);
y2 = 2*cos(2*x);
plot (x,y1,x,y2);

x = 0:1:10;
y = x.^2 -10.*x +15;
plot(x,y,'r--',x,y,'bo');
x=0:pi/100:2*pi;
y1=sin(2*x);
y2=2*cos(2*x);
plot(x,y1,'k-',x,y2,'b--');
title(' Plot of f(x)=sin(2x) and its derivative');
xlabel('x');
ylabel('y');
legend('f(x)','d/dx f(x)') %和
plot(x,y1,'k-',x,y2,'b--')对应,用于生成图标签
grid on;
%Prompt the user for the input temperature.
temp_f=input('Enter the temperature in degrees Fahrenheit:');
%Converttokelvins.
temp_k=(5/9)*(temp_f-32)+273.15;
%Writeouttheresult.
fprintf('%6.2f degrees Fahrenheit = %6.2f kelvins.\n',
temp_f,temp_k);
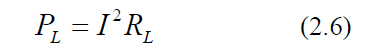
%Set the values of source voltage and internal resistance
volts=120;
rs=50;
%Create an array of load resistances
rl=1:1:100;
%Calculate the current flow for each resistance
amps=volts./(rs+rl);
%Calculate the power supplied to the load
pl=(amps.^2).*rl;
%Plot the power versus load resistance
plot(rl,pl);
title('Plot of power versus load resistance');
xlabel('Load resistance(ohms)');
ylabel('Power(watts)');
grid on;


a = 0;
b = sin(pi);
a == b
ans =
0

if (b^2 - 4*a*c) < 0
disp('This equation has two complex roots.');
elseif (b^2 - 4*a*c) == 0
disp('This equation has two identical real roots.');
else
disp('This equation has two distinct real roots.');
end
%
求解二次方程
% Prompt the user for the coefficients of the equation
disp ('This program solves for the roots of a quadratic ');
disp ('equation of the form A*X^2 + B*X + C = 0.');
a = input('Enter the coefficient A: ');
if a==0
a = input('Enter the coefficient A: ');
end;
b = input('Enter the coefficient B: ');
c = input('Enter the coefficient C: ');
% Calculate discriminant
discriminant = b^2 - 4 * a * c;
% Solve for the roots, depending on the vlaue of the discriminant.
if discriminant > 0 % there are two real roots, so ...
x1 = (-b + sqrt(discriminant)) / (2*a);
x2 = (-b - sqrt(discriminant)) / (2*a);
disp('This equation has two real roots:');
fprintf('x1 = %f\n', x1);
fprintf('x2 = %f\n', x2);
elseif discriminant == 0 % there is one repeated root, so ...
x1 = ( -b ) / (2*a);
disp('This equation has two identical real roots:');
fprintf('x1 = x2 = %f\n', x1);
else % there are complex roots, so ...
real_part = (-b) / (2*a);
imag_part = sqrt( abs(discriminant)) / (2*a);
disp('This equation has complex roots:');
fprintf('x1 = %f + i %f \n',real_part, imag_part);
fprintf('x1 + %f - i %f \n', real_part, imag_part);
end
% Prompt the user for the values x and y
x = input('Enter the x coefficient: ');
y = input('Enter the y coefficient: ');
% Calculate the function f(x,y) based upon
% the signs of x and y.
if x>=0 & y>=0
fun = x + y;
elseif x>=0 & y<0
fun = x + y^2;
elseif x<0 & y>=0
fun = x^2 + y;
else
fun = x^2 + y^2;
end
% Write the value of the function.
disp(['The vlaue of the function is ' num2str(fun)]);
value = input('输入一个值:');
switch (value)
case {1, 3, 5, 7, 9},
disp('The value is odd.');
case {2, 4, 6, 8, 10},
disp('The value is even.');
otherwise,
disp('The value is out of range.');
end
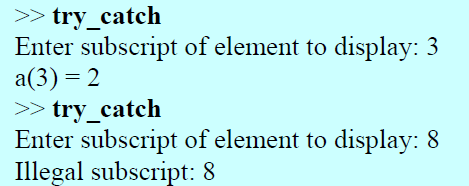
%将可能出问题的代码放在try中
% Initialize array
a = [ 1 -3 2 5];
try
% Try to display an element
index = input('Enter subscript of element to display: ');
disp(['a(' int2str(index) ') = ' num2str(a(index))] );
catch
% If we get here an error occurred
disp( ['Illegal subscript: ' int2str(index)] );
end
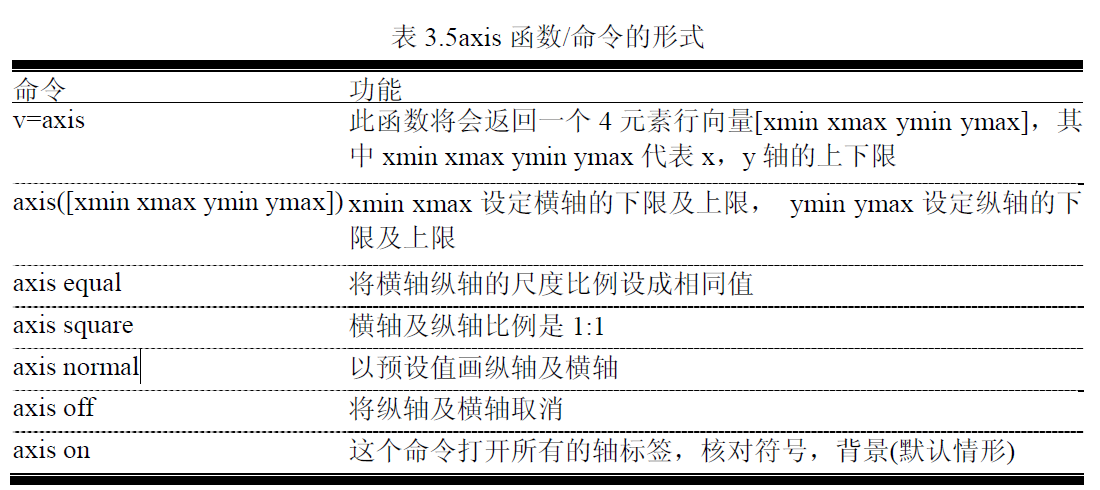
意只有带有字符参数的函数才能当作命令。带有数字参数的函数只能被当作函数。这
就是为什么axis 有时当作命令,有时被当作函数。
x = -pi:pi/20:pi;
y1 = sin(x);
y2 = cos(x);
plot(x,y1,'b-');
hold on;
plot(x,y2,'k--');
hold off;
legend ('sin x','cos x');
%
plot(x,y1,'k-',x,y2,'b--');
当hold on 命令执行后,所有的新的图象都会叠
加在原来存在的图象。hold off 命令可恢复默认情况,用新的图象来替代原来的图象。
figure(1);
x = x:0.05:2;%为什么可以X开始,默认为-4
y1 = exp(x);
plot(x,y1);
figure(2);
y2 = exp(-x);
plot(x,y2);
figure(1);
subplot(2,1,1);
x = -pi:pi/20:pi;
y = sin(x);
plot(x,y);
title('Subplot 1 title');
subplot(2,1,2);
x = -pi:pi/20:pi;
y = cos(x);
plot(x,y);
title('Subplot 2 title');
x = 0:pi/10:2*pi;
x1 = cos(2*x);
y1 = sin(x);
plot(x1,y1,'-ro','LineWidth',2.0,'MarkerSize',6,'MarkerEdgeColor','b','MarkerFaceColor','b')
%循环:
在循环体中绝不修改循环指数的值。
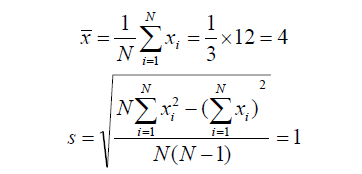
期望,方差:3,4,5
%first
% Initialize sums.
n = 0; sum_x = 0; sum_x2 = 0;
% Read in first value
x = input('Enter first value: ');
% While Loop to read input values.
while x >= 0
% Accumulate sums.n = n + 1;sum_x = sum_x + x;sum_x2 = sum_x2 + x^2;% Read in next valuex = input('Enter next value: ');
end
% Check to see if we have enough input data.
if n < 2 % Insufficient information
disp('At least 2 values must be entered!');
else % There is enough information, so
% calculate the mean and standard deviationx_bar = sum_x / n;std_dev = sqrt( (n * sum_x2 - sum_x^2) / (n * (n-1)) );fprintf('The mean of this data set is: %f\n', x_bar);fprintf('The standard deviation is: %f\n', std_dev);fprintf('The number of data points is: %f\n', n);
end
%second
% Initialize sums.
sum_x = 0; sum_x2 = 0;
% Get the number of points to input.
n = input('Enter number of points: ');
% Check to see if we have enough input data.
if n < 2 % Insufficient data
disp ('At least 2 values must be entered.');
else % we will have enough data, so let's get it.
% Loop to read input values.for ii = 1:n% Read in next valuex = input('Enter value: ');% Accumulate sums.sum_x = sum_x + x;sum_x2 = sum_x2 + x^2;end% Now calculate statistics.x_bar = sum_x / n;std_dev = sqrt((n * sum_x2 - sum_x^2) / (n * (n - 1)));% Tell user.fprintf('The mean of this data set is: %f\n', x_bar);fprintf('The standard deviation is: %f\n', std_dev);fprintf('The number of data points is: %f\n', n);
end
for ii = 1:10
disp(['test' num2str(ii)]);
end
for ii = 1:2:10
disp(['test' num2str(ii)]);
end
for ii = [1 3 5]
disp(['test' num2str(ii)]);
end
for ii = [1 3 5;2 4 6]
jj = ii
end
% Get day, month, and year to convert
disp('This program calculates the day of year given the ');
disp('current date.');
month = input('Enter current month (1-12):');
day = input('Enter current day(1-31):');
year = input('Enter current year(yyyy): ');
% Check for leap year, and add extra day if necessary
if mod(year,400) == 0
leap_day = 1; % Years divisible by 400 are leap years
elseif mod(year,100) == 0
leap_day = 0; % Other centuries are not leap years
elseif mod(year,4) == 0
leap_day = 1; % Otherwise every 4th year is a leap year
else
leap_day = 0; % Other years are not leap years
end
% Calculate day of year by adding current day to the
% days in previous months.
day_of_year = day;
for ii = 1:month - 1
% Add days in months from January to last monthswitch (ii)case {1,3,5,7,8,10,12},day_of_year = day_of_year + 31;case {4,6,9,11},day_of_year = day_of_year + 30;case 2,day_of_year = day_of_year + 28 + leap_day;
end
end
% Tell user
fprintf('The date %2d/%2d/%4d is day of year %d.\n', ...
month, day, year, day_of_year);
%循环
for ii = 1:100
square(ii) = ii ^2;square_root(ii) = ii ^ (1/2);cube_root(ii) = ii ^ (1/3);
end
%向量
ii = 1:100;
square = ii .^2;
square_root = ii .^ (1/2);
cube_root(ii) = ii .^ (1/3);
%cube_root = ii .^ (1/3);%结果一样
for 循环算法比向量算法慢
15 倍还多
tic; % Start timer
for jj = 1:1000
clear square % Clear output arrayii = 1:10000; % Set up vectorsquare = ii.^2; % Calculate square
end
average3 = (toc)/1000; % Calculate average time
disp('This program performs a leastsquares fit of an ');
disp('input data set to a straight line.');
n_points = input('Enter the number of input [x y] points: ');
% Read the input data
for ii = 1:n_points
temp = input('Enter [x y] pair: ');
x(ii) = temp(1);
y(ii) = temp(2);
end
% Accumulate statistics
sum_x = 0;
sum_y = 0;
sum_x2 = 0;
sum_xy = 0;
for ii = 1:n_points
sum_x = sum_x + x(ii);
sum_y = sum_y + y(ii);
sum_x2 = sum_x2 + x(ii)^2;
sum_xy = sum_xy + x(ii) * y(ii);
end
% Now calculate the slope and intercept.
x_bar = sum_x / n_points;
y_bar = sum_y / n_points;
slope = (sum_xy - sum_x * y_bar) / ( sum_x2 - sum_x * x_bar);
y_int = y_bar - slope * x_bar;
% Tell user.
disp('Regression coefficients for the leastsquares line:');
fprintf(' Slope (m) = %8.3f\n', slope);
fprintf(' Intercept (b) = %8.3f\n', y_int);
fprintf(' No of points = %8d\n', n_points);
% Plot the data points as blue circles with no
% connecting lines.
plot(x,y,'bo');
hold on;
% Create the fitted line
xmin = min(x);
xmax = max(x);
ymin = slope * xmin + y_int;
ymax = slope * xmax + y_int;
% Plot a solid red line with no markers
plot([xmin xmax],[ymin ymax],'r','LineWidth',2);
hold off;
% Add a title and legend
title ('\bfLeastSquaresFit');
xlabel('\bf\itx');
ylabel('\bf\ity');
legend('Input data','Fitted line');
grid on
% Constants
conv = pi / 180; % Degreestoradians conversion factor
g = -9.81; % Accel. due to gravity
vo = 20; % Initial velocity
%Create an array to hold ranges
range = zeros(1,91); % Calculate maximum ranges
for ii = 1:91
theta = ii - 1;vxo = vo * cos(theta*conv);vyo = vo * sin(theta*conv);traj_time = -2 * vyo / g;range(ii) = vxo * traj_time;
end
% Write out table of ranges
fprintf ('Range versus angle theta:\n');
for ii = 1:91
theta = ii - 1;fprintf(' %2d %8.4f\n',theta, range(ii));
end
% Calculate the maximum range and angle
[maxrange index] = max(range);
maxangle = index - 1;
fprintf ('\nMax range is %8.4f at %2d degrees.\n',maxrange, maxangle);
% Now plot the trajectories
for ii = 5:10:85
% Get velocities and max time for this angletheta = ii;vxo = vo * cos(theta*conv);vyo = vo * sin(theta*conv);traj_time = -2 * vyo / g;% Calculate the (x,y) positionsx = zeros(1,21);y = zeros(1,21);for jj = 1:21time = (jj - 1) * traj_time/20;x(jj) = vxo * time;y(jj) = vyo * time + 0.5 * g * time^2;endplot(x,y,'b');if ii == 5hold on;
end
end
% Add titles and axis lables
title ('\bfTrajectory of Ball vs Initial Angle \theta');
xlabel ('\bf\itx \rm\bf(meters)');
ylabel ('\bf\ity \rm\bf(meters)');
axis ([0 45 0 25]);
grid on;
% Now plot the max range trajectory
vxo = vo * cos(maxangle*conv);
vyo = vo * sin(maxangle*conv);
traj_time = -2 * vyo / g;
% Calculate the (x,y) positions
x = zeros(1,21);
y = zeros(1,21);
for jj = 1:21
time = (jj - 1) * traj_time/20;x(jj) = vxo * time;y(jj) = vyo * time + 0.5 * g * time^2;
end
plot(x,y,'r','LineWidth',3.0);
hold off
函数:
function out = test1(a, b)
fprintf('In Sample: a = %f, b = %f %f\n',a,b);
a = b(1) + 2*a;
%b = a .* b;
b=b.*a;
out = a + b(1);
fprintf('In Sample: a = %f, b = %f %f \n',a,b);
a = 2; b = [6 4];
fprintf('Before sample: a = %f, b = %f %f\n', a, b);
out = test1(a, b);
fprintf('After sample: a = %f, b = %f %f\n',a,b);
fprintf('After sample: out = %f \n', out);
%global
%不能global a = 100;global a; a=100;
%
简单随机数发生器的算法。它是利用大数求余的不可预知性
%有问题
function ran = random0(n,m)
global ISEED % Seed for random number generator
% Check for a legal number of input arguments.
ISEED = n;
msg = nargchk(1,2,nargin);
error(msg);
% If the m argument is missing, set it to n.
if nargin < 2
m = n;
end
% Initialize the output array
ran = zeros(n,m);
% Now calculate random values
for ii = 1:n
for jj = 1:mISEED = mod(8121*ISEED + 28411, 134456 );ran(ii,jj) = ISEED / 134456;end
end
比如在主函数里面,你需要设置data这个变量是一个全局变量,就需要声明一下:
global data;
然后在子函数里面你又用到了data这个全局变量,你需要在子函数里面再次声明:
global data;
这样在子函数中,就可以使用data这个全局变量了
%persistent
%类似于静态变量
function [ave, std] = runstats(x)
% Declare persistent values
persistent n % Number of input values
persistent sum_x % Running sum of values
persistent sum_x2 % Running sum of values squared
% Check for a legal number of input arguments.
msg = nargchk(1,1,nargin);
error(msg);
% If the argument is 'reset', reset the running sums.
if x == 'reset'
n = 0;sum_x = 0;sum_x2 = 0;
else
n = n + 1;sum_x = sum_x + x;sum_x2 = sum_x2 + x^2;
end
% Calculate ave and sd
if n == 0
ave = 0;std = 0;
elseif n == 1
ave = sum_x;std = 0;
else
ave = sum_x / n;std = sqrt((n*sum_x2 - sum_x^2) / (n*(n - 1)));
end
%进行测试
% First reset running sums
[ave std] = runstats('reset');
% Prompt for the number of values in the data set
nvals = input('Enter number of values in data set: ');
% Get input values
for ii = 1:nvals
% Prompt for next valuestring = ['Enter value ' int2str(ii) ': '];x = input(string);% Get running statistics[ave std] = runstats(x);% Display running statisticsfprintf('Average = %8.4f; Std dev = %8.4f\n',ave, std);
end
%对字符串求值
%eval是解释字符串表达式并求值:eval('2^2')->4
eval(string)
x = 1;
str = ['exp(' num2str(x) ')-1'];
%
str = 'exp(' num2str(x) ')-1';会进行不同的解析
res = eval(str);
res = eval(str);
函数feval 对在M 文件进行定义的函数通过其名称进行调用然后求值,要求有指定的输入值。
feval(‘funname', value)
%实例
%fun为funname,xlin为x的取值范围[1 4]
function quickplot(fun,xlim)
% Check for a legal number of input arguments.
msg = nargchk(2,2,nargin);
error(msg);
% Check the second argument to see if it has two
% elements. Note that this double test allows the
% argument to be either a row or a column vector.
%size(xlim,1)返回数组的行数,size(xlim,2)返回数组的列数
if ( size(xlim,1) == 1 & size(xlim,2) == 2 ) | ...
( size(xlim,1) == 2 & size(xlim,2) == 1 )% Ok --continue processing.n_steps = 100;step_size = (xlim(2) - xlim(1)) / n_steps;x = xlim(1):step_size:xlim(2);y = feval(fun,x);plot(x,y);title(['\bfPlot of function ' fun '(x)']);xlabel('\bfx');ylabel(['\bf' fun '(x)']);
else
% Else wrong number of elements in xlim.error('Incorrect number of elements in xlim.');
end
quickplot('sin', [-2*pi 2*pi])

常用函数:
nargin 这个函数返回调用这个函数时所需要的实际输入参数的个数
nargout 这个函数返回调用这个函数时所需要的实际输出参数的个数
nargchk 如要一个函数调用被调用时参数过多或过少,那么nargchk 函数将返回一个标
准错误信息
error 显示错误信息,并中止函数以免它产生这个错误。如果参数错误是致命的,这
个函数将会被调用。
warning 显示警告信息并继续执行函数,如果参数错误不是致命的,执行还能继续,则
这个将会被调用。
inputname 这个函数将会返回对于特定参数个数的实际变量名。
rand 产生一个随机数
rand(n) 产生一个n×n 的随机数数组
rand(n,m) 产生一个n×m 的随机数数组
rand 用于产生等可能的随机数
randn 用于产生普通的随机数
a = ['a';'b']
b = char('a','b')
函数strcat 水平连接两字符串,忽略所有字符串末端的空格,而字符串的空格保留
result = strcat('string 1 ','String 2') :
string 1String 2

result = strvcat('Long String 1 ','String 2')
result =
Long String 1
String 2
strcmp 判断两字符串是否等价
strcmpi 忽略大小写判断两字符串是否等价
strncmp 判断两字符串前n 个字符是否等价
strncmpi 忽略大小写判断两字符串前n 个字符是否等价
c = strcmp(‘a’,'A')
c=0
isletter 用来判断一个字符是否为字母
isspace
判断一个字符是否为空白字符(空格,tab
,换行符)
a = isletter(
'Room 23a'
)
a =
1 1 1 1 0 0 0 1
函数findstr 返回短字符串在长字符串中所有的开始位置
position = findstr(
'This is a test!'
,'is')
position =
3 6
函数strmatch
看二维数组行开头的字符,并返回那些以指
定的字符序列为开头行号
array = strvcat('maxarray','min value','max value');
array = strvcat('array
max
','min value','max value','max');
result = strmatch('max',array)
result = upper('This is test 1!')
result = lower('This is test 2!')
b = eval(
'3.141592'
)%字符串转换数字
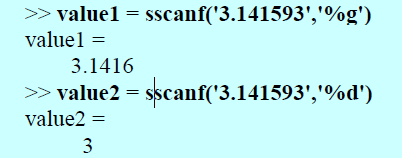
%g:为浮点数
%d:为整数
num2str(1);
int2str(1);
a = [1 2 3; 4 5 6]
b = mat2str(a)
b =
[1 2 3;4 5 6]

单元索引:
a = cell(2, 2)
a{1,1} = [1 3 -7; 2 0 6; 0 5 1];
a{1,2} = 'This is a text string.';
a{2,1} = [3+4*i -5; -10*i 3-4*i];
a{2,2} = [];
a(1,1) ={[1 3 -7; 2 0 6;0 5 1]};
a(1,2) = {'This is a text string.'};
a(2,1) = {[3+4*i -5; -10*i 3-4*i]};
a(2,2) = {[]};
b = {[1 2], 17, [2;4]; 3-4*i, 'Hello', eye(3)}
b =
[1x2 double] [ 17] [2x1 double]
[3.0000- 4.0000i] 'Hello' [3x3 double]
celldisk(b)%查看详细信息
b(2,:)=[]%删除第二行
b{1,1}(1,2)%访问单元元素中的元素
结构体:
student.name = 'a';
student.addr1 = 'b';
student.city = 'c';
student.zip = 'd'
student为一个数据时:student = student(1)
student(2).name = 'A'
student(2)
ans =
name: 'B'
addr1: []
city: []
zip: []
stu = rmfield(student, 'zip') %rmfield删除结构体中的域
student(1).name = [1,2,3]
mean(student(1).name
)%求平均值
%遍历结构体数组
for ii = 1:length(student)
disp(student(ii).name);
end
f = getfield(array,{array_index},'field',{field_index})
zip = getfield(student,{2})
zip =
name: 'B'
addr1: []
city: []
zip: []
zip = getfield(student,{2},'name')
zip =
B
f = setfield(array,{array_index},'field',{field_index},value) %?????
结构体嵌套:
student(1).class(1).name = 'COSC 2021';
student(1).class(2).name = 'PHYS 1001';
student(1).class(1).instructor = 'Mr. Jones';
student(1).class(2).instructor = 'Mrs. Smith';
matlab文件操作
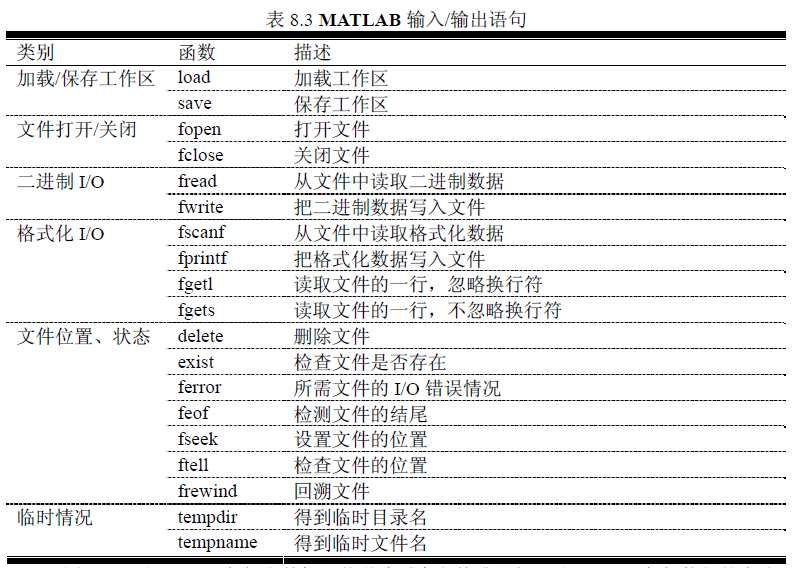
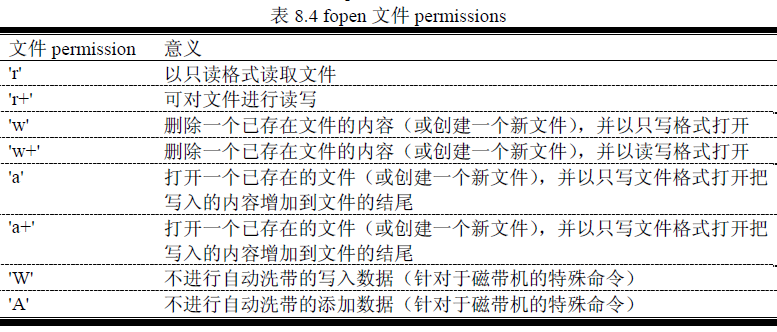
fid = fopen(filename, permission)
[fid, message] = fopen(filename, permission)
[fid, message] = fopen(filename,permission, format)
如果文件被成功打开,在这个语句执行
之后,
fid 将为一个正整数,
message 将为一个空字符。如果文件打开失败,在这个语句执行
之后,fid 将为-1,message 将为解释错误出现的字符串
fid = fopen('example.dat','r')
status = fclose(
example.dat
) %成功为0,失败为-1
%实例对文件进行读写
filename = input('Enter file name: ','s');
% Generate the data array
out_array = randn(1,10000);
% Open the output file for writing.
[fid,msg] = fopen(filename,'w');
% Was the open successful?
if fid > 0
% Write the output data.count = fwrite(fid,out_array,'float64');% Tell userdisp([int2str(count) ' values written...']);% Close the filestatus = fclose(fid);
else
% Output file open failed. Display message.disp(msg);
end
% Now try to recover the data. Open the
% file for reading.
[fid,msg] = fopen(filename,'r');
% Was the open successful?
if fid > 0
% Read the input data.[in_array, count] = fread(fid,[100 100],'float64');% Tell userdisp([int2str(count) ' values read...']);% Close the filestatus = fclose(fid);
else
% Input file open failed. Display message.disp(msg);
end
fprintf(' Table of Square Roots, Squares, and Cubes\n\n');
% Print column headings
fprintf(' Number Square Root Square Cube\n');
fprintf(' ====== =========== ====== ====\n');
% Generate the required data
ii = 1:10;
square_root = sqrt(ii);
square = ii.^2;
cube = ii.^3;
% Create the output array
out = [ii' square_root' square' cube'];%将行转换成列
% Print the data
for ii = 1:10
fprintf (' %2d %11.4f %6d %8d\n',out(ii,:));
end
ident = exist('item'); %ident的取值含义

%
out_filename = input('Enter output filename: ','s');
% Check to see if the file exists.
if exist(out_filename,'file')
% The file existsdisp('Output file already exists.');yn = input('Keep existing file? (y/n) ','s');if yn == 'n'fid = fopen(out_filename,'wt');
else
fid = fopen(out_filename,'at');
end
else
% File doesn't existfid = fopen(out_filename,'wt');
end
% Output data
fprintf(fid,'%s\n',date);
% Close file
fclose(fid);
fid=fopen('fgetl.m');
while 1
tline = fgetl(fid);
if ~ischar(tline), break, end
disp(tline)
end
fclose(fid);
fid = fopen('exp.txt','w');
fprintf(fid,'%6.2f %12.8f\n',y);
fclose(fid);
%执行fclose后内容才会写到文件中去


 2382
2382


 被折叠的 条评论
为什么被折叠?
被折叠的 条评论
为什么被折叠?
 到【灌水乐园】发言


