


gdb debug an android application
1.gdb
-
要有gdbserver
一般模拟器默认装有gdbserver,如2.3.3的模拟器,看一下有没有:
D:\Developer\sdk\platform-tools>adb shell ls -l /system/bin/gdb*
-rwxr-xr-x root shell 5664 2010-07-01 05:03 gdbjithelpe
-rwxr-xr-x root shell 151868 2010-05-11 09:39 gdbserver
没有的需要adb push android_server /data/local/tmp
然后给权限chmod 755 android_server
-
目标程序
安装 adb install D:\Developer\Cygwin\crackme.l2.sign.apk
启动
-
找到pid
这里用某开关显示标题ps -h;,因为没有head命令。
adb shell "ps -h;ps | grep crack"
adb shell "cat /proc/21126/maps | grep crack"
或者windows下findstr,因为2.3.3没有grep
D:\Developer\sdk\platform-tools>adb shell "ps -h" & adb shell "ps" | findstr crack
USER PID PPID VSIZE RSS WCHAN PC NAME
app_45 2045 32 176352 22556 ffffffff afd0eb08 S com.crackme
-
启动gdbserver
adb shell /system/bin/gdbserver :5039 --attach 21126
-
端口
例外开一个命令行窗口进程,输入
adb forward tcp:5039 tcp:5039
adb forward tcp:6100 tcp:7100 // PC上所有6100端口通信数据将被重定向到手机端7100端口server上
或者
adb forward tcp:6100 local:logd // PC上所有6100端口通信数据将被重定向到手机端UNIX类型socket上
-
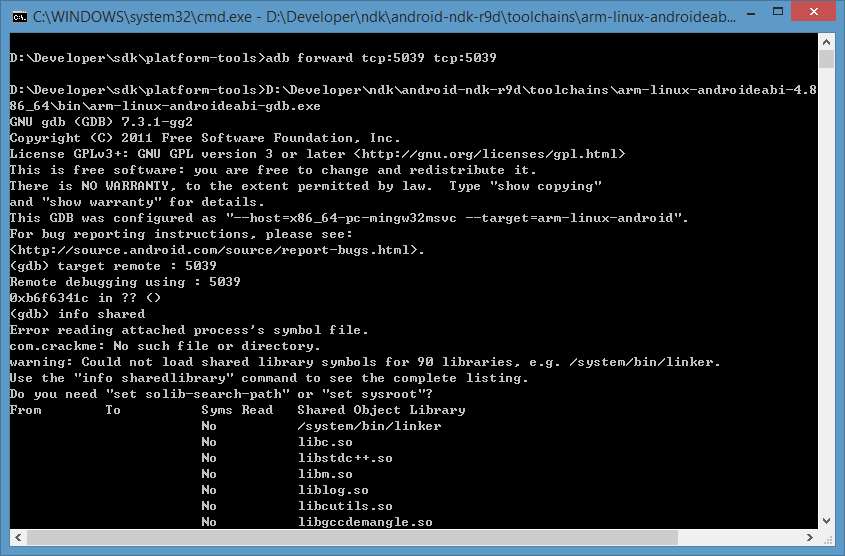
启动gdb
D:\Developer\ndk\android-ndk-r9d\toolchains\arm-linux-androideabi-4.8\prebuilt\windows-x86_64\bin
arm-linux-androideabi-gdb.exe
-
连接远程gdbserver
(gdb) target remote : 5039
-
OK
gdb
好了可以使用命令了,如
(gdb) info shared
name@pc ~
$ adb nodaemon server
cannot bind 'tcp:5037'name@pc ~
$ netstat -ano | findstr "5037"
TCP 127.0.0.1:5037 0.0.0.0:0 LISTENING 7740name@pc ~
$ taskkill /F /pid 7740
SUCCESS: The process with PID 7740 has been terminated.name@pc ~
$ netstat -ano | findstr "5037"name@pc ~
$ adb start-server
* daemon not running. starting it now on port 5037 *
* daemon started successfully *name@pc ~
$ adb nodaemon server
cannot bind 'tcp:5037'name@pc ~
$ netstat -ano | findstr "5037"
TCP 127.0.0.1:5037 0.0.0.0:0 LISTENING 11116name@pc ~
$ tasklist | findstr 11116
adb.exe 11116 Console 6 5,740 Kname@pc ~
$ adb devices
List of devices attached

如果同时有其他调试,如ida,可能失败,如下错误
D:\Developer\sdk\platform-tools>adb shell /system/bin/gdbserver :5039 --attach 2045
Cannot attach to process 2045: Operation not permitted (1)
2. 断点
-
符号/地址
下断点,如果没有导入符号,需要这样计算某个函数地址:

San@Fang /cygdrive/d/Developer/sdk/platform-tools
$ readelf -sW ./libdvm.so | grep dvmCallJNIMethod_general
1022: 0003de01 74 FUNC GLOBAL DEFAULT 7 dvmCallJNIMethod_general
San@Fang /cygdrive/d/Developer/sdk/platform-tools
$ ./adb shell cat /proc/2045/maps | findstr libdvm
80800000-80886000 r-xp 00000000 1f:00 362 /system/lib/libdvm.so
80886000-80889000 rwxp 00086000 1f:00 362 /system/lib/libdvm.so
/system/lib/libdvm.so的首地址+dvmCallJNIMethod_general符号位置,80800000 + 0003de01 = 8083DE01
附:
xref: /bionic/linker/linker.cpp /system/bin/linker
xref: /dalvik/vm/Native.cpp /system/lib/libdvm.so
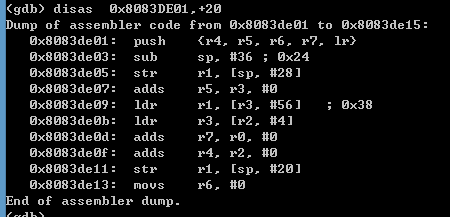
| (gdb) help disas (gdb) disas 0x8083DE01,+20
Dump of assembler code from 0x8083de01 to 0x8083de15: | (gdb) help x Defaults for format and size letters are those previously used. (gdb) x/20i 0x8083DE01 0x8083de01: push {r4, r5, r6, r7, lr} |
| gdb dvmCallJNIMethod_general | ida dvmCallJNIMethod_general |
 | 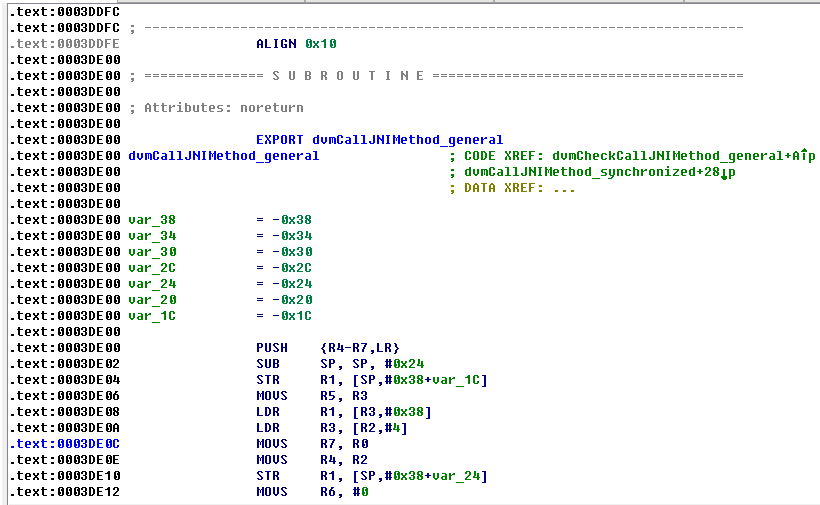 |

(gdb) help break
Set breakpoint at specified line or function.
break [LOCATION] [thread THREADNUM] [if CONDITION]
LOCATION may be a line number, function name, or "*" and an address.
If a line number is specified, break at start of code for that line.
If a function is specified, break at start of code for that function.
If an address is specified, break at that exact address.
With no LOCATION, uses current execution address of the selected
stack frame. This is useful for breaking on return to a stack frame.
THREADNUM is the number from "info threads".
CONDITION is a boolean expression.
Multiple breakpoints at one place are permitted, and useful if their
conditions are different.
Do "help breakpoints" for info on other commands dealing with breakpoints
(gdb) break *0x8083de01
warning: Breakpoint address adjusted from 0x8083de01 to 0x8083de00.
Cannot access memory at address 0x0
Breakpoint 2 at 0x8083de00
(gdb) break *0x8083de00
Note: breakpoints 1 and 2 also set at pc 0x8083de00.
Breakpoint 3 at 0x8083de00
(gdb) info b
Num Type Disp Enb Address What
1 breakpoint keep y 0x8083de00
stop only if {char*}($r2+0x10) == 0x434c3bc8
2 breakpoint keep y 0x8083de00
3 breakpoint keep y 0x8083de00
当断点在0x8083de00上时,注意寄存器r2大小写:
(gdb) p {char*}($r2+0x10)
$24 = 0x434c3e18 "native_getClipBounds"
(gdb) p {char*}($r2+0x10)
$30 = 0x434c3bc8 "native_computeBounds"
(gdb) p ($r2+0x10)
$31 = 1108273640
(gdb) p/u ($r2+0x10)
$32 = 1108273640
(gdb) p/a ($r2+0x10)
$33 = 0x420ee9e8
-
条件断点
这里有介绍条件断点5.1.6 Break Conditions = https://www.sourceware.org/gdb/onlinedocs/gdb/Conditions.html#Conditions,但是没有好的方法下字符串断点。


5.1.1 Setting Breakpoints

Breakpoints are set with the break command (abbreviated b). The debugger convenience variable ‘$bpnum’ records the number of the breakpoint you’ve set most recently; see Convenience Variables, for a discussion of what you can do with convenience variables.

break location
Set a breakpoint at the given location, which can specify a function name, a line number, or an address of an instruction. (See Specify Location, for a list of all the possible ways to specify a location.) The breakpoint will stop your program just before it executes any of the code in the specified location.

When using source languages that permit overloading of symbols, such as C++, a function name may refer to more than one possible place to break. See Ambiguous Expressions, for a discussion of that situation.

It is also possible to insert a breakpoint that will stop the program only if a specific thread (see Thread-Specific Breakpoints) or a specific task (see Ada Tasks) hits that breakpoint.

break
When called without any arguments, break sets a breakpoint at the next instruction to be executed in the selected stack frame (see Examining the Stack). In any selected frame but the innermost, this makes your program stop as soon as control returns to that frame. This is similar to the effect of a finish command in the frame inside the selected frame—except that finish does not leave an active breakpoint. If you use break without an argument in the innermost frame, GDB stops the next time it reaches the current location; this may be useful inside loops.

GDB normally ignores breakpoints when it resumes execution, until at least one instruction has been executed. If it did not do this, you would be unable to proceed past a breakpoint without first disabling the breakpoint. This rule applies whether or not the breakpoint already existed when your program stopped.

break … if cond
Set a breakpoint with condition cond; evaluate the expression cond each time the breakpoint is reached, and stop only if the value is nonzero—that is, if cond evaluates as true. ‘…’ stands for one of the possible arguments described above (or no argument) specifying where to break. See Break Conditions, for more information on breakpoint conditions.

tbreak args
Set a breakpoint enabled only for one stop. The args are the same as for the break command, and the breakpoint is set in the same way, but the breakpoint is automatically deleted after the first time your program stops there. See Disabling Breakpoints.

hbreak args
Set a hardware-assisted breakpoint. The args are the same as for the break command and the breakpoint is set in the same way, but the breakpoint requires hardware support and some target hardware may not have this support. The main purpose of this is EPROM/ROM code debugging, so you can set a breakpoint at an instruction without changing the instruction. This can be used with the new trap-generation provided by SPARClite DSU and most x86-based targets. These targets will generate traps when a program accesses some data or instruction address that is assigned to the debug registers. However the hardware breakpoint registers can take a limited number of breakpoints. For example, on the DSU, only two data breakpoints can be set at a time, and GDB will reject this command if more than two are used. Delete or disable unused hardware breakpoints before setting new ones (see Disabling Breakpoints). See Break Conditions. For remote targets, you can restrict the number of hardware breakpoints GDB will use, see set remote hardware-breakpoint-limit.

thbreak args
Set a hardware-assisted breakpoint enabled only for one stop. The args are the same as for the hbreak command and the breakpoint is set in the same way. However, like the tbreak command, the breakpoint is automatically deleted after the first time your program stops there. Also, like the hbreak command, the breakpoint requires hardware support and some target hardware may not have this support. See Disabling Breakpoints. See also Break Conditions.

rbreak regex
Set breakpoints on all functions matching the regular expression regex. This command sets an unconditional breakpoint on all matches, printing a list of all breakpoints it set. Once these breakpoints are set, they are treated just like the breakpoints set with the break command. You can delete them, disable them, or make them conditional the same way as any other breakpoint.

The syntax of the regular expression is the standard one used with tools like grep. Note that this is different from the syntax used by shells, so for instance foo* matches all functions that include an fo followed by zero or more os. There is an implicit .* leading and trailing the regular expression you supply, so to match only functions that begin with foo, use ^foo.

When debugging C++ programs, rbreak is useful for setting breakpoints on overloaded functions that are not members of any special classes.

The rbreak command can be used to set breakpoints in all the functions in a program, like this:

(gdb) rbreak .
rbreak file:regex
If rbreak is called with a filename qualification, it limits the search for functions matching the given regular expression to the specified file. This can be used, for example, to set breakpoints on every function in a given file:

(gdb) rbreak file.c:.
The colon separating the filename qualifier from the regex may optionally be surrounded by spaces.

info breakpoints [n…]
info break [n…]
Print a table of all breakpoints, watchpoints, and catchpoints set and not deleted. Optional argument n means print information only about the specified breakpoint(s) (or watchpoint(s) or catchpoint(s)). For each breakpoint, following columns are printed:

Breakpoint Numbers
Type
Breakpoint, watchpoint, or catchpoint.

Disposition
Whether the breakpoint is marked to be disabled or deleted when hit.

Enabled or Disabled
Enabled breakpoints are marked with ‘y’. ‘n’ marks breakpoints that are not enabled.

Address
Where the breakpoint is in your program, as a memory address. For a pending breakpoint whose address is not yet known, this field will contain ‘<PENDING>’. Such breakpoint won’t fire until a shared library that has the symbol or line referred by breakpoint is loaded. See below for details. A breakpoint with several locations will have ‘<MULTIPLE>’ in this field—see below for details.

What
Where the breakpoint is in the source for your program, as a file and line number. For a pending breakpoint, the original string passed to the breakpoint command will be listed as it cannot be resolved until the appropriate shared library is loaded in the future.

If a breakpoint is conditional, there are two evaluation modes: “host” and “target”. If mode is “host”, breakpoint condition evaluation is done by GDB on the host’s side. If it is “target”, then the condition is evaluated by the target. The info break command shows the condition on the line following the affected breakpoint, together with its condition evaluation mode in between parentheses.

Breakpoint commands, if any, are listed after that. A pending breakpoint is allowed to have a condition specified for it. The condition is not parsed for validity until a shared library is loaded that allows the pending breakpoint to resolve to a valid location.

info break with a breakpoint number n as argument lists only that breakpoint. The convenience variable $_ and the default examining-address for the x command are set to the address of the last breakpoint listed (see Examining Memory).

info break displays a count of the number of times the breakpoint has been hit. This is especially useful in conjunction with the ignore command. You can ignore a large number of breakpoint hits, look at the breakpoint info to see how many times the breakpoint was hit, and then run again, ignoring one less than that number. This will get you quickly to the last hit of that breakpoint.

For a breakpoints with an enable count (xref) greater than 1, info break also displays that count.

GDB allows you to set any number of breakpoints at the same place in your program. There is nothing silly or meaningless about this. When the breakpoints are conditional, this is even useful (see Break Conditions).

It is possible that a breakpoint corresponds to several locations in your program. Examples of this situation are:

Multiple functions in the program may have the same name.
For a C++ constructor, the GCC compiler generates several instances of the function body, used in different cases.
For a C++ template function, a given line in the function can correspond to any number of instantiations.
For an inlined function, a given source line can correspond to several places where that function is inlined.
In all those cases, GDB will insert a breakpoint at all the relevant locations.

A breakpoint with multiple locations is displayed in the breakpoint table using several rows—one header row, followed by one row for each breakpoint location. The header row has ‘<MULTIPLE>’ in the address column. The rows for individual locations contain the actual addresses for locations, and show the functions to which those locations belong. The number column for a location is of the form breakpoint-number.location-number.

For example:

Num     Type           Disp Enb  Address    What
1       breakpoint     keep y    <MULTIPLE>
        stop only if i==1
        breakpoint already hit 1 time
1.1                         y    0x080486a2 in void foo<int>() at t.cc:8
1.2                         y    0x080486ca in void foo<double>() at t.cc:8
Each location can be individually enabled or disabled by passing breakpoint-number.location-number as argument to the enable and disable commands. Note that you cannot delete the individual locations from the list, you can only delete the entire list of locations that belong to their parent breakpoint (with the delete num command, where num is the number of the parent breakpoint, 1 in the above example). Disabling or enabling the parent breakpoint (see Disabling) affects all of the locations that belong to that breakpoint.

It’s quite common to have a breakpoint inside a shared library. Shared libraries can be loaded and unloaded explicitly, and possibly repeatedly, as the program is executed. To support this use case, GDB updates breakpoint locations whenever any shared library is loaded or unloaded. Typically, you would set a breakpoint in a shared library at the beginning of your debugging session, when the library is not loaded, and when the symbols from the library are not available. When you try to set breakpoint, GDB will ask you if you want to set a so called pending breakpoint—breakpoint whose address is not yet resolved.

After the program is run, whenever a new shared library is loaded, GDB reevaluates all the breakpoints. When a newly loaded shared library contains the symbol or line referred to by some pending breakpoint, that breakpoint is resolved and becomes an ordinary breakpoint. When a library is unloaded, all breakpoints that refer to its symbols or source lines become pending again.

This logic works for breakpoints with multiple locations, too. For example, if you have a breakpoint in a C++ template function, and a newly loaded shared library has an instantiation of that template, a new location is added to the list of locations for the breakpoint.

Except for having unresolved address, pending breakpoints do not differ from regular breakpoints. You can set conditions or commands, enable and disable them and perform other breakpoint operations.

GDB provides some additional commands for controlling what happens when the ‘break’ command cannot resolve breakpoint address specification to an address:

set breakpoint pending auto
This is the default behavior. When GDB cannot find the breakpoint location, it queries you whether a pending breakpoint should be created.

set breakpoint pending on
This indicates that an unrecognized breakpoint location should automatically result in a pending breakpoint being created.

set breakpoint pending off
This indicates that pending breakpoints are not to be created. Any unrecognized breakpoint location results in an error. This setting does not affect any pending breakpoints previously created.

show breakpoint pending
Show the current behavior setting for creating pending breakpoints.

The settings above only affect the break command and its variants. Once breakpoint is set, it will be automatically updated as shared libraries are loaded and unloaded.

For some targets, GDB can automatically decide if hardware or software breakpoints should be used, depending on whether the breakpoint address is read-only or read-write. This applies to breakpoints set with the break command as well as to internal breakpoints set by commands like next and finish. For breakpoints set with hbreak, GDB will always use hardware breakpoints.

You can control this automatic behaviour with the following commands::

set breakpoint auto-hw on
This is the default behavior. When GDB sets a breakpoint, it will try to use the target memory map to decide if software or hardware breakpoint must be used.

set breakpoint auto-hw off
This indicates GDB should not automatically select breakpoint type. If the target provides a memory map, GDB will warn when trying to set software breakpoint at a read-only address.

GDB normally implements breakpoints by replacing the program code at the breakpoint address with a special instruction, which, when executed, given control to the debugger. By default, the program code is so modified only when the program is resumed. As soon as the program stops, GDB restores the original instructions. This behaviour guards against leaving breakpoints inserted in the target should gdb abrubptly disconnect. However, with slow remote targets, inserting and removing breakpoint can reduce the performance. This behavior can be controlled with the following commands::

set breakpoint always-inserted off
All breakpoints, including newly added by the user, are inserted in the target only when the target is resumed. All breakpoints are removed from the target when it stops.

set breakpoint always-inserted on
Causes all breakpoints to be inserted in the target at all times. If the user adds a new breakpoint, or changes an existing breakpoint, the breakpoints in the target are updated immediately. A breakpoint is removed from the target only when breakpoint itself is removed.

set breakpoint always-inserted auto
This is the default mode. If GDB is controlling the inferior in non-stop mode (see Non-Stop Mode), gdb behaves as if breakpoint always-inserted mode is on. If GDB is controlling the inferior in all-stop mode, GDB behaves as if breakpoint always-inserted mode is off.

GDB handles conditional breakpoints by evaluating these conditions when a breakpoint breaks. If the condition is true, then the process being debugged stops, otherwise the process is resumed.

If the target supports evaluating conditions on its end, GDB may download the breakpoint, together with its conditions, to it.

This feature can be controlled via the following commands:

set breakpoint condition-evaluation host
This option commands GDB to evaluate the breakpoint conditions on the host’s side. Unconditional breakpoints are sent to the target which in turn receives the triggers and reports them back to GDB for condition evaluation. This is the standard evaluation mode.

set breakpoint condition-evaluation target
This option commands GDB to download breakpoint conditions to the target at the moment of their insertion. The target is responsible for evaluating the conditional expression and reporting breakpoint stop events back to GDB whenever the condition is true. Due to limitations of target-side evaluation, some conditions cannot be evaluated there, e.g., conditions that depend on local data that is only known to the host. Examples include conditional expressions involving convenience variables, complex types that cannot be handled by the agent expression parser and expressions that are too long to be sent over to the target, specially when the target is a remote system. In these cases, the conditions will be evaluated by GDB.

set breakpoint condition-evaluation auto
This is the default mode. If the target supports evaluating breakpoint conditions on its end, GDB will download breakpoint conditions to the target (limitations mentioned previously apply). If the target does not support breakpoint condition evaluation, then GDB will fallback to evaluating all these conditions on the host’s side.

GDB itself sometimes sets breakpoints in your program for special purposes, such as proper handling of longjmp (in C programs). These internal breakpoints are assigned negative numbers, starting with -1; ‘info breakpoints’ does not display them. You can see these breakpoints with the GDB maintenance command ‘maint info breakpoints’ (see maint info breakpoints).
10.1 Expressions
GDB supports array constants in expressions input by the user. The syntax is {element, element…}. For example, you can use the command
print {1, 2, 3}to create an array of three integers. If you pass an array to a function or assign it to a program variable, GDB copies the array to memory that ismalloced in the target program.Because C is so widespread, most of the expressions shown in examples in this manual are in C. See Using GDB with Different Languages, for information on how to use expressions in other languages.
In this section, we discuss operators that you can use in GDB expressions regardless of your programming language.
Casts are supported in all languages, not just in C, because it is so useful to cast a number into a pointer in order to examine a structure at that address in memory.
GDB supports these operators, in addition to those common to programming languages:
@‘@’ is a binary operator for treating parts of memory as arrays. See Artificial Arrays, for more information.
::‘::’ allows you to specify a variable in terms of the file or function where it is defined. See Program Variables.
{type} addrRefers to an object of type type stored at address addr in memory. The address addr may be any expression whose value is an integer or pointer (but parentheses are required around binary operators, just as in a cast). This construct is allowed regardless of what kind of data is normally supposed to reside ataddr.
(gdb) symbol-file D:/Developer/sdk/platforms/android-19/lib/libc.so
Reading symbols from D:/Developer/sdk/platforms/android-19/lib/libc.so...done.
WARNING: no debugging symbols found in D:/Developer/sdk/platforms/android-19/lib/libc.so.
Either the binary was compiled without debugging information
or the debugging information was removed (e.g., with strip or strip -g).
Debugger capabilities will be very limited.
For further information: http://wiki/Main/GdbFaq#No_debugging_symbols_found
-
字符串断点
break *0x8083de01 if $gdb_strcmp((char*)($r2+0x10),"chinaunix") == 0
break *0x8083de00 if $r2+0x10 != 0 && 0 != (char*)($r2+0x10) && 'c' == *(char*)($r2+0x10) && 'r' == *(1+(char*)($r2+0x10)) 崩溃
break *0x8083de00 if {char*}($r2+0x10) == 0x434c3bc8 崩溃
(gdb) break *0x8083de01 Quit (expect signal SIGINT when the program is resumed)0x10))
< && 0 != (char*)($r2+0x10) && 'c' == *(char*)($r2+0x10) && 'r' == *(1+(char*)($r2+0x10))
warning: Breakpoint address adjusted from 0x8083de01 to 0x8083de00.
Cannot access memory at address 0x0
Breakpoint 11 at 0x8083de00
(gdb) info b
Num Type Disp Enb Address What
11 breakpoint keep y 0x8083de00
stop only if $r2+0x10 != 0 && 0 != (char*)($r2+0x10) && 'c' == *(char*)($r2+0x10) && 'r' == *(1+(char*)($r2+0x10
))
(gdb) c
Continuing.
Error in testing breakpoint condition:
Cannot access memory at address 0x420ee9e8
Cannot remove breakpoints because program is no longer writable.
Further execution is probably impossible.
warning: Breakpoint 11 address previously adjusted from 0x8083de01 to 0x8083de00.
-
....
..


 1503
1503


 被折叠的 条评论
为什么被折叠?
被折叠的 条评论
为什么被折叠?
 到【灌水乐园】发言


