


折线图
一、项目分析
依据该数据分别以折线图、条形图显示该年奥运会总奖牌数前5名国家的金牌数、银牌数、铜牌数、奖牌总数数据。
二、项目实施思路
可以为每一年创建一个列表,并将金牌、银牌、铜牌的数量存储在相应的变量中。绘制堆砌条形图和对应的折线图。
三、项目实施技术路线
- 数据准备:代码定义了两个字典,分别存储了2020年和2016年的奥运奖牌数据。
- 数据筛选:从2020年的数据中筛选出前五名的国家,并根据总数进行排序。同样,从2016年的数据中筛选出前五名的国家,并进行排序。
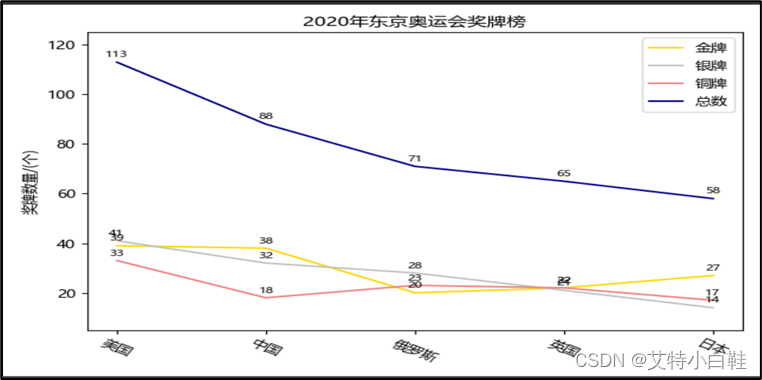
- 折线图绘制:首先绘制了2020年东京奥运会的奖牌榜折线图,显示了金牌、银牌、铜牌和总数。
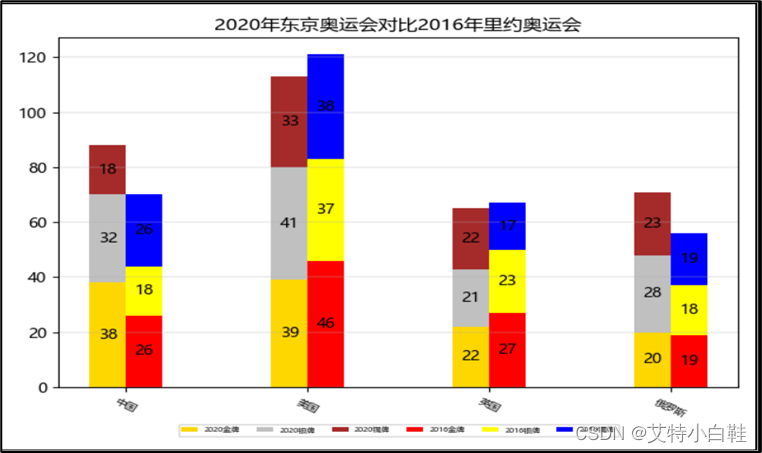
- 条形图绘制:绘制了一个条形图,比较了2020年东京奥运会和2016年里约奥运会的奖牌情况。
- 图表展示:使用plt.show()函数显示了所有生成的图表数据分析
四、项目总结
|
图4-1 东京奥运会对比里约奥运会 |
代码使用了plt.bar()函数来绘制条形图,并使用了plt.text()函数在条形图上添加了具体的数值标签。同时,使用了多个plt.bar()函数来绘制两个奥运会的条形图,并通过调整bottom参数来正确显示每个国家的奖牌数量。
五、项目总结
通过对比这两个图表,我们可以看到2020年和2016年奥运会的奖牌榜情况。中国在这两个奥运会上都表现出色,特别是在总数上排名靠前。美国在这两个奥运会上也表现强劲,但2020年的金牌数量略少于2016年。其他国家如日本、英国和俄罗斯在这两个奥运会上都有不错的表现,但奖牌总数相对较少。
六、程序代码
import matplotlib.pyplot as plt
import matplotlib.markers
marker = matplotlib.markers.CARETDOWNBASE
import pandas as pd
import numpy as np

box_style=['circle','darrow','larrow','rarrow','round','round4','roundtooth','sawtooth','square']
font=['KaiTi','LiSu','STSong','FangSong','YouYuan','FZShuTi','STXinwei','STCaiyun','STZhongsong','STHupo','Microsoft YaHei','Microsoft JhengHei']
#显示中文字体
plt.rcParams['font.sans-serif'] = font[4]
plt.rcParams['axes.unicode_minus'] = False
color=['red','orange','yellow','lightgreen','green','black']

import matplotlib.pyplot as plt
import numpy as np
import pandas as pd
font = [['STCaiyun'],['Microsoft YaHei'],['STXinwei']]
plt.rcParams['font.sans-serif'] = font[1]
plt.rcParams['axes.unicode_minus'] = False
data_2020_6 = {
    "国家": ["美国", "中国", "日本", "英国", "俄罗斯","澳大利亚"],
    "金牌": [39, 38, 27, 22, 20, 17],
    "银牌": [41, 32, 14, 21, 28, 7],
    "铜牌": [33, 18, 17, 22, 23, 22],
    "总数": [113, 88, 58, 65, 71, 46]
}
data_2016_5 = {
    "国家": ["美国", "英国", "中国", "俄罗斯", "德国"],
    "金牌": [46, 27, 26, 19, 17],
    "银牌": [37, 23, 18, 18, 10],
    "铜牌": [38, 17, 26, 19, 15],
    "总数": [121, 67, 70, 56, 42]
}
df_2020_6 = pd.DataFrame(data_2020_6)
df_2016_5 = pd.DataFrame(data_2016_5)

data_2020 = df_2020_6.sort_values(by='总数',
                                  ascending=False).head(5)# 2020年有六个国家,根据总数排序,并选出前5的国家
data_2020.index = range(0, len(data_2020))                # 更新索引

data_2016 = df_2016_5.sort_values(by='总数', ascending=False).head(5)
data_2016.index = range(0, len(data_2016))

x = [1,2,3,4,5]
x1 = data_2020["国家"]
x2 = data_2016["国家"]
medal_type = ["金牌","银牌","铜牌","总数"]
colors = ['gold', 'silver', 'lightcoral', 'darkblue']

plt.ylim(5,125)
# ----------折线图--------------
plt.title("2020年东京奥运会奖牌榜")
plt.ylabel("奖牌数量/(个)")
plt.xticks(x,x1,rotation=-30)
for r,medal1 in enumerate(medal_type):
    y1 = data_2020[medal1]
    plt.plot(x,y1,color=colors[r],label=medal1)
    for i in range(len(x1)):
        plt.text(i+1, y1[i] + 2, y1[i], fontsize=8, horizontalalignment='center')
plt.legend()
plt.pause(1)
plt.xticks(x,x2,rotation=-30)
plt.title("2016年里约奥运会奖牌榜")
for t,medal2 in enumerate(medal_type):
    y2 = data_2016[medal2]
    plt.plot(x,y2,color=colors[t],label=medal2)
    for i in range(len(x2)):
        plt.text(i+1, y2[i] + 2, y2[i], fontsize=8, horizontalalignment='center')
plt.legend()
plt.pause(1)
# ------条形图--------
bar_2020_4 = data_2020.drop(4)
bar_2016_4 = data_2016.drop(4)
new_order = ["中国", "美国", "英国", "俄罗斯"]
medal_bar = ["金牌","银牌","铜牌"]
bar_2020 = bar_2020_4.set_index('国家').reindex(new_order).reset_index()
bar_2016 = bar_2016_4.set_index('国家').reindex(new_order).reset_index()

xb = np.arange(1,5)
bottom = [0] * len(bar_2020['国家'])
m = [0] * len(bar_2020['国家'])
bottom1 = [0] * len(bar_2020['国家'])
colors1 = ['gold', 'silver', 'brown']
colors2 = ['red','yellow','blue']
labels1 = []
labels2 = []
for f,medal_b1 in enumerate(medal_bar):
    yb1 = bar_2020[medal_b1]
    labels1.append(f'2020{medal_b1}')
    plt.bar(xb-0.1,yb1,bottom=bottom,width=0.2,
            align='center',color=colors1[f],label=labels1[f])
    for i in range(len(xb)):
        bottom[i] += yb1[i]
        plt.text(xb[i]-0.1,bottom[i]-yb1[i]/2,yb1[i],va='center',ha='center')
for p,medal_b2 in enumerate(medal_bar):
    yb2 = bar_2016[medal_b2]
    labels2.append(f'2016{medal_b2}')
    plt.bar(xb+0.1,yb2,bottom=bottom1,width=0.2,
            align='center',color=colors2[p],label=labels2[p])
    for i in range(len(xb)):
        bottom1[i] += yb2[i]
        plt.text(xb[i]+0.1,bottom1[i]-yb2[i]/2,yb2[i],va='center',ha='center')
plt.title('2020年东京奥运会对比2016年里约奥运会')
plt.legend(loc='lower center',ncol=6,bbox_to_anchor=(0.5,-0.15),fontsize=5)
plt.xticks(xb,bar_2020['国家'],rotation=-30,fontsize=7)
plt.grid(axis='y',linewidth=0.3)
plt.show()


 18万+
18万+

 被折叠的 条评论
为什么被折叠?
被折叠的 条评论
为什么被折叠?
 到【灌水乐园】发言


